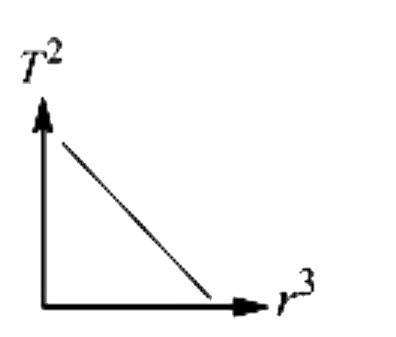
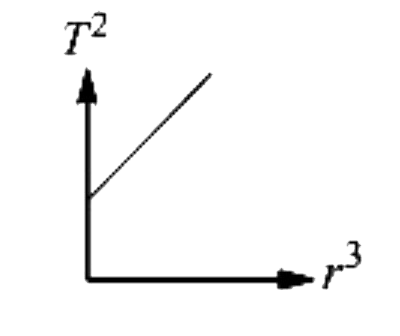
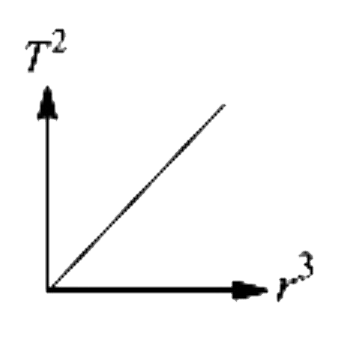
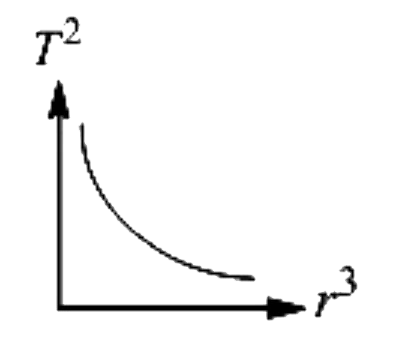
Which of the following graphs between the square of the time period and cube of the distance of the planet from the sun is correct ?


The correct Answer is:C
To solve the problem regarding the relationship between the square of the time period (T²) and the cube of the distance (R³) of a planet from the Sun, we can follow these steps:
Step 1: Understand Kepler's Third Law
Kepler's Third Law states that the square of the orbital period (T) of a planet is directly proportional to the cube of the semi-major axis (R) of its orbit. Mathematically, this can be expressed as:
T2∝R3
This means that:
T2=k⋅R3
where k is a constant of proportionality.
Step 2: Rearranging the Equation
From the above relationship, we can rearrange it to show that:
T2=kR3
This indicates that if we plot T2 on the y-axis and R3 on the x-axis, the relationship will be linear.
Step 3: Graph Characteristics
Since the equation T2=kR3 is linear, the graph will be a straight line. The line will pass through the origin (0,0) because when R=0, T2 will also be 0.
Step 4: Identify the Correct Graph
Given the options for the graph, we need to identify which one represents a straight line passing through the origin. This will be the graph that correctly represents the relationship between T2 and R3.
Conclusion
Based on our analysis, the correct graph that represents the relationship between the square of the time period and the cube of the distance of the planet from the Sun is option C.
---
Kepler's Third Law states that the square of the orbital period (T) of a planet is directly proportional to the cube of the semi-major axis (R) of its orbit. Mathematically, this can be expressed as:
T2∝R3
This means that:
T2=k⋅R3
where k is a constant of proportionality.
From the above relationship, we can rearrange it to show that:
T2=kR3
This indicates that if we plot T2 on the y-axis and R3 on the x-axis, the relationship will be linear.
Since the equation T2=kR3 is linear, the graph will be a straight line. The line will pass through the origin (0,0) because when R=0, T2 will also be 0.
Given the options for the graph, we need to identify which one represents a straight line passing through the origin. This will be the graph that correctly represents the relationship between T2 and R3.
Based on our analysis, the correct graph that represents the relationship between the square of the time period and the cube of the distance of the planet from the Sun is option C.
Similar Questions
Which of the following graph between (x/m) vs P is correct?
View SolutionWhich of the following is the graph between the height (h) of a projectile and time (t), when it is projected from the ground
View SolutionThe graph between the length and square of the period of a simple pendulum is a
View SolutionWhich of the following x-t graphs represents the distance-time variation of a body released from the top of a buiding?
View SolutionWhich of the following is a correct match between period and its associated event?
View SolutionWhich of the following graphs represents the motion of the planet moving about the Sun. T is the periode of revolution and r is the average distance (from centre to centre) between the sun and the planet
View SolutionWhich of the following distance time graphs is possible ?
View SolutionWhich of the following statements are correct about a planet revolving around Sun ?
View SolutionThe time of revolution of planet A round the sun is 8 times that of another planet B. The distance of planet A from the sun is how many times the distance of B from the sun
View SolutionFor a uniformly charged non conducting sphere of radius R which of following shows a correct graph between the electric field intensity and the distance from the centre of sphere –
View Solution
