What type of graph we get when plot a graph PV against P at constant temperature? What is shown by this graph? Solution in Malayalam
Step by step video & image solution for What type of graph we get when plot a graph PV against P at constant temperature? What is shown by this graph? by Chemistry experts to help you in doubts & scoring excellent marks in Class 11 exams.
Updated on:21/07/2023Similar Questions
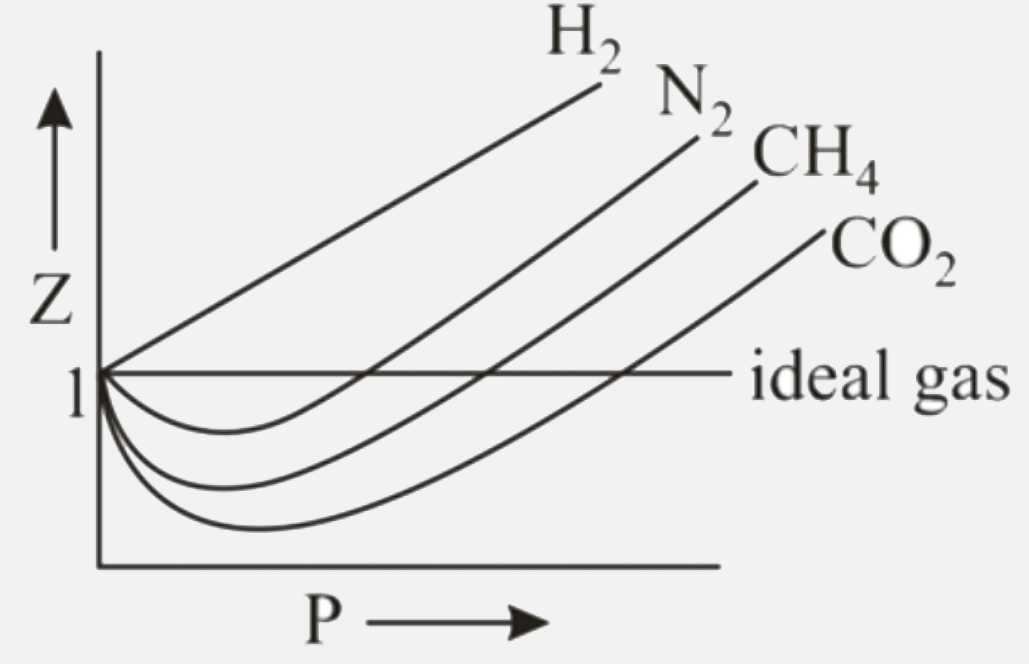
Compressibility factor (Z=PVnRT) is plotted against pressure

Which is the correct order of liquefiability of the gases shown in the above graph ?
View SolutionWhat type of graph would you get when PV is plotted against P at constant temperature ?
View SolutionWhat is difference between real gas and ideal gas is graph of pV→p at constant temperature.
View SolutionWhich type of graph is obtained when we plotted pV→p of ideal gas ?
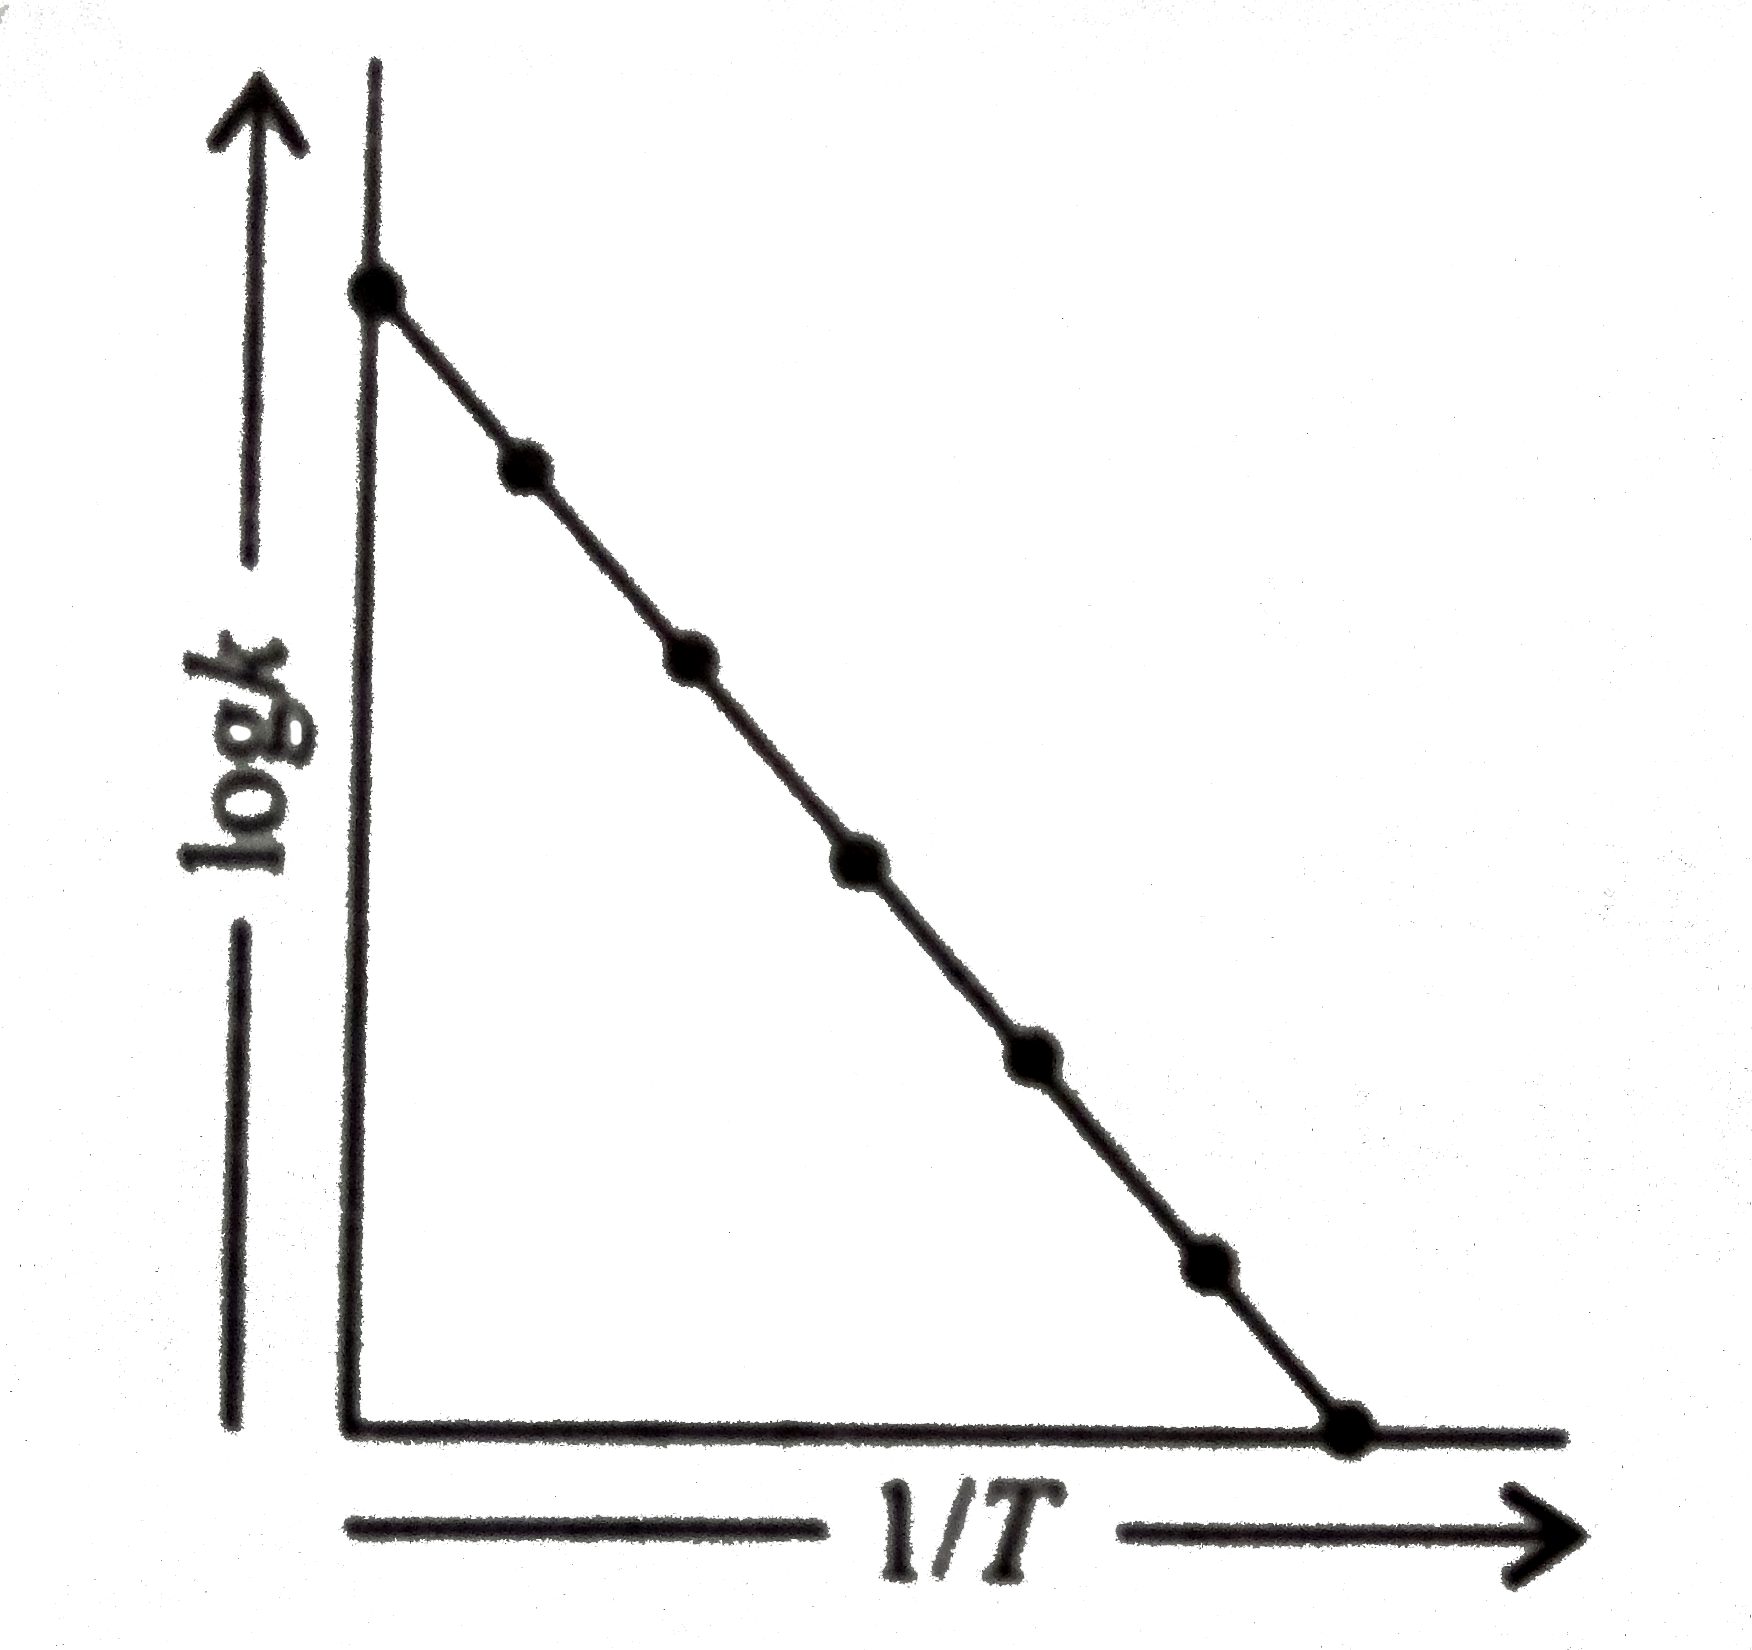
View SolutionThe temperature dependence of the rate constant k is expressed as k=Ae−Ea/RT
When a plot between logk and 1/T is plotted we get the graph as shown.

What is the value of slopw in the graph?
View SolutionAt constant temperature, the effect of change of pressure on volume of a gas was as given below Plot the following graphs : PV vs P.
View SolutionWhat is the type of graph between log P and log V at constant temperature?
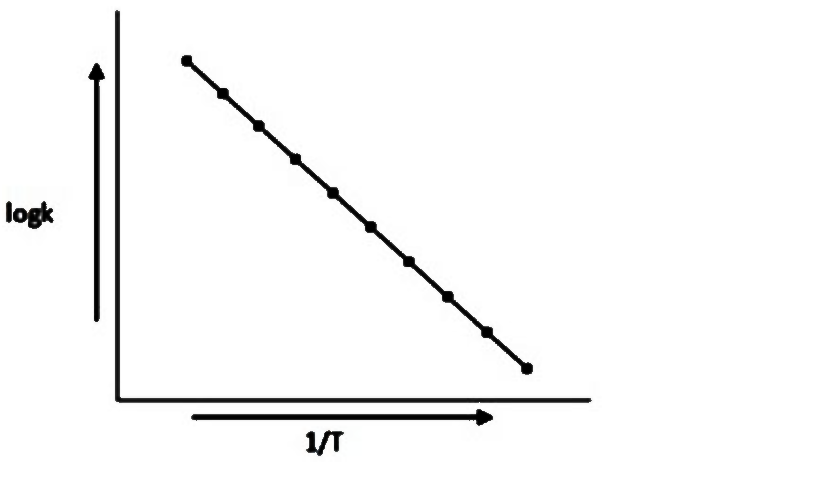
View SolutionWhen a plot between logk and 1/T is plotted we get the graph as shown.

What is the value of slope in the graph?
View Solution
