A watch company produced four different products. The sales of these products in lakhs during 2005 and 2010 are shown in the following bar diagram. Study the graph and answer the questions.
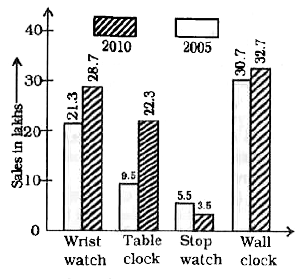
The sales have increased by nearly 135% from 2005 to 2010 in the product of
Table clock/मेज घड़ी
Wrist watch/कलाई घड़ी
Stop watch/विराम घड़ी
Wall clock /दीवार घड़ी
Step by step video & image solution for A watch company produced four different products. The sales of these products in lakhs during 2005 and 2010 are shown in the following bar diagram. Study the graph and answer the questions. The sales have increased by nearly 135% from 2005 to 2010 in the product of by Maths experts to help you in doubts & scoring excellent marks in Class 14 exams.
Updated on:21/07/2023Topper's Solved these Questions
Similar Questions
A watch company produces four different products. The sate of these products in lakhs during 2005 and 2010 are shown in the following bar diagram, Study the graph and answer the questions.
एक घड़ी कंपनी चार भिन्न उत्पाद बनाती है । इन उत्पादों की 2005 और 2010 में लाखें में बिक्री निम्मलिखित बार डायग्राम में दर्शायी गई है । ग्राफ का अध्ययन कीजिए और दिए गए प्रश्नों के उत्तर दीजिए ।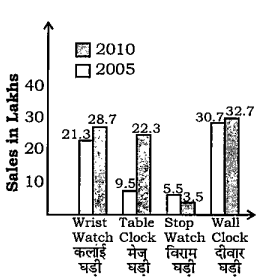 <br>
The sales of table clock in 2005 was less than the sales of wall clock in 2005 is nearly by -
2005 में मेज घड़ी की बिक्री 2005 में दीवार घड़ी की बिक्री से लगभग कितने प्रतिशत कम हुई ?
View SolutionThe following graph shows the production of wheat flour (in 1000 tonnes) by three companies X, Y and Z over the years. Study the graph and answer the questions.
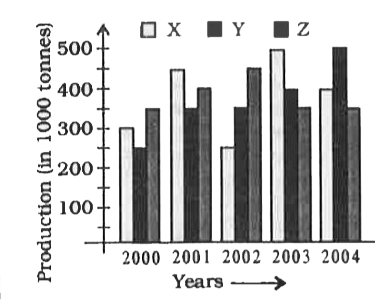
What is the percentage Increase in the production of company Y from 2002 to 2003?
View Solution
Knowledge Check
A watch company produced four different products. The sales of these products in lakhs during 2005 and 2010 are shown in the following bar diagram. Study the graph and answer the questions.
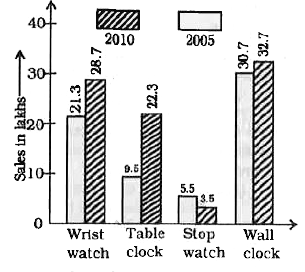
The sales in percentage of wrist watch in 2010 more than the sales of table clock in 2010 was nearly byA26.7%B27.7%C28.7%D21.7%A watch company produced four different products. The sales of these products in lakhs during 2005 and 2010 are shown in the following bar diagram. Study the graph and answer the questions.
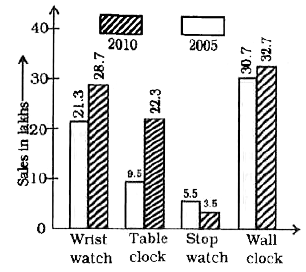
During the period 2005-2010 the minimum rate of increase in sales in the product ofAWrist watchBTable clockCStop watchDWall clockA watch company produced four different products. The sales of these products in lakhs during 2005 and 2010 are shown in the following bar diagram. Study the graph and answer the questions.
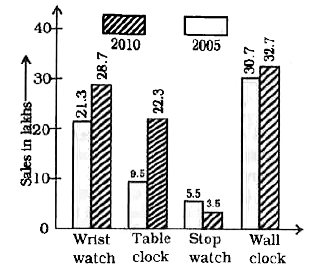
The sales of table clock in 2005 was less than the sales of wall clock in 2005 is nearly byA(a) 70.05%B(b) 69.05%C(c) 68.05%D(d) 62.05%
Direction : Study the following bar diagram carefully and answer the four questions.
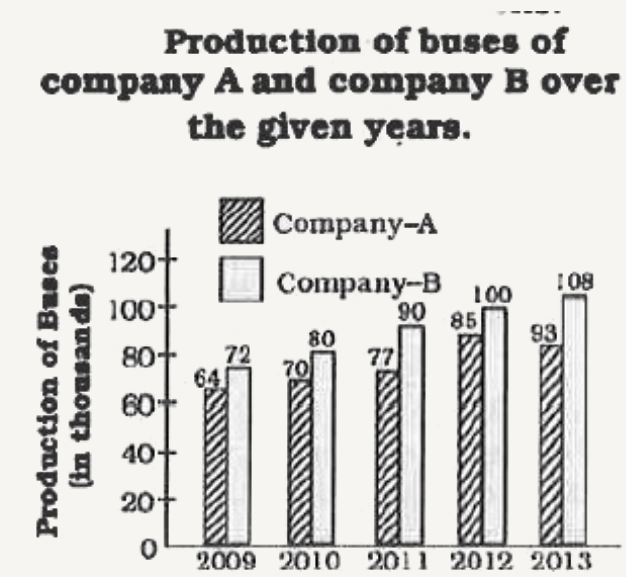
The average production (in thousand) of company A over the years 2010, 2011, 2012, 2013 is
View SolutionProduction of three different flavours soft drinks X, Y and Z over a period of six years has been expressed in the following graph. Study the graph and answer the questions
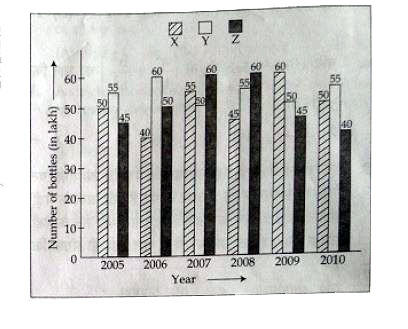
The difference (in lakh bottles) between the average production of flavour X in 2005, 2006 2007 and the average production of flavour Y in 2008, 2009 and 2010 is
View SolutionA watch company produced four different products. The sales of these products in lakhs during 2005 and 2010 are shown in the following bar diagram. Study the graph and answer the questions.
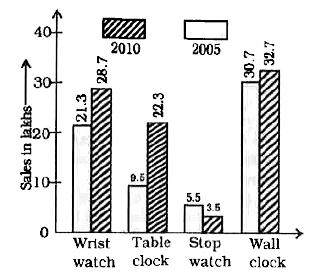
The ratio of sales of stop watch in 2010 to the sale of table clock in 2005 is
View SolutionThe graph shows the production of food grains of a country in different years. Study the graph and answer the questions.
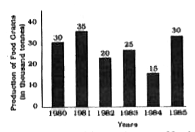
The percentage increase in production from 1984 to 1985 was
View SolutionA health drink company prepares the drink of three different flavours P, Q, R. The production of three flavours over a period of six years has been expressed on bar graph provided below. Study the graph and answer the questions.
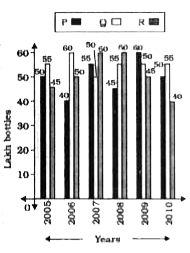
What is the different between the average production of flavour Q in 2008, 2009 and 2010 from that of flavour P in 2005, 2006 and 2007 (in lakhs bottles) ?
View Solution
