A watch company produced four different products. The sales of these products in lakhs during 2005 and 2010 are shown in the following bar diagram. Study the graph and answer the questions.
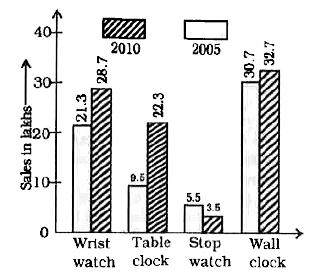
The ratio of sales of stop watch in 2010 to the sale of table clock in 2005 is
6:19
7:6
19:6
7:19
The correct Answer is:D
Step by step video, text & image solution for A watch company produced four different products. The sales of these products in lakhs during 2005 and 2010 are shown in the following bar diagram. Study the graph and answer the questions. The ratio of sales of stop watch in 2010 to the sale of table clock in 2005 is by Maths experts to help you in doubts & scoring excellent marks in Class 14 exams.
Topper's Solved these Questions
- BOOK - KIRAN PUBLICATIONCHAPTER - STATISTICS AND DATA INTERPRETATIONEXERCISE - TYPE-V38videos
STATISTICS AND DATA INTERPRETATION
- BOOK - KIRAN PUBLICATIONCHAPTER - STATISTICS AND DATA INTERPRETATIONEXERCISE - TYPE-VI86videos
STATISTICS AND DATA INTERPRETATION
- BOOK - KIRAN PUBLICATIONCHAPTER - STATISTICS AND DATA INTERPRETATIONEXERCISE - TYPE-III39videos
STATISTICS AND DATA INTERPRETATION
- BOOK - KIRAN PUBLICATIONCHAPTER - SIMPLIFICATIONEXERCISE - TEST YOURSELF25videos
SIMPLIFICATION
- BOOK - KIRAN PUBLICATIONCHAPTER - TIME AND DISTANCEEXERCISE - Type -XI74videos
TIME AND DISTANCE
Similar Questions
A watch company produces four different products. The sate of these products in lakhs during 2005 and 2010 are shown in the following bar diagram, Study the graph and answer the questions.
एक घड़ी कंपनी चार भिन्न उत्पाद बनाती है । इन उत्पादों की 2005 और 2010 में लाखें में बिक्री निम्मलिखित बार डायग्राम में दर्शायी गई है । ग्राफ का अध्ययन कीजिए और दिए गए प्रश्नों के उत्तर दीजिए ।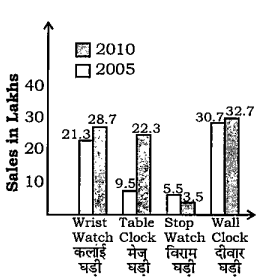 <br>
The sales of table clock in 2005 was less than the sales of wall clock in 2005 is nearly by -
2005 में मेज घड़ी की बिक्री 2005 में दीवार घड़ी की बिक्री से लगभग कितने प्रतिशत कम हुई ?View SolutionDirections for questions : These questions are based on the following data. Read the following bar graph and answer the questions.
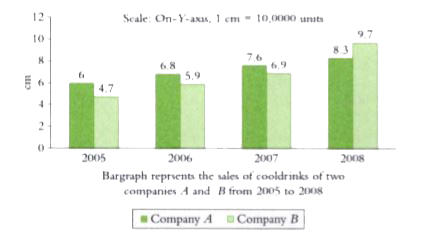
In which year is the sales of B more than the sales of A?View Solution
Knowledge Check
- Question 1 - Select One
A watch company produced four different products. The sales of these products in lakhs during 2005 and 2010 are shown in the following bar diagram. Study the graph and answer the questions.
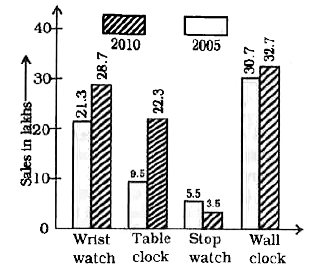
The sales of table clock in 2005 was less than the sales of wall clock in 2005 is nearly byA(a) 70.05%B(b) 69.05%C(c) 68.05%D(d) 62.05% - Question 2 - Select One
A watch company produced four different products. The sales of these products in lakhs during 2005 and 2010 are shown in the following bar diagram. Study the graph and answer the questions.
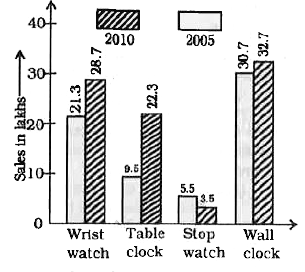
The sales in percentage of wrist watch in 2010 more than the sales of table clock in 2010 was nearly byA26.7%B27.7%C28.7%D21.7% - Question 3 - Select One
A watch company produced four different products. The sales of these products in lakhs during 2005 and 2010 are shown in the following bar diagram. Study the graph and answer the questions.
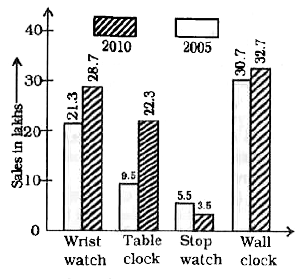
The sales have increased by nearly 135% from 2005 to 2010 in the product ofA(a) Table clockB(b) Wrist watchC(c) Stop watchD(d) Wall clock
The following graph shows the sales of cars (in thousands) in four cities in 4 years. Study the graph and answer the question.
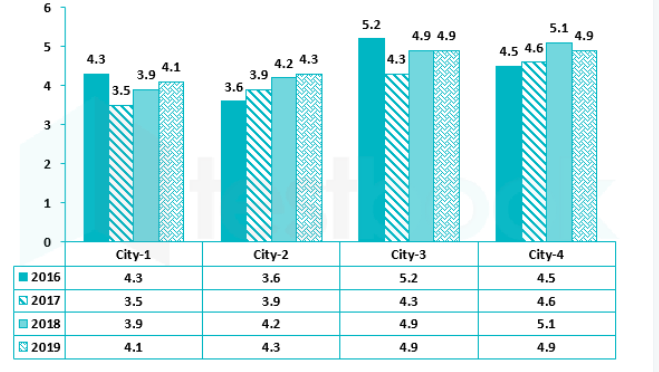
Which city has the highest sales?View SolutionDirection : Study the following bar diagram carefully and answer the four questions.
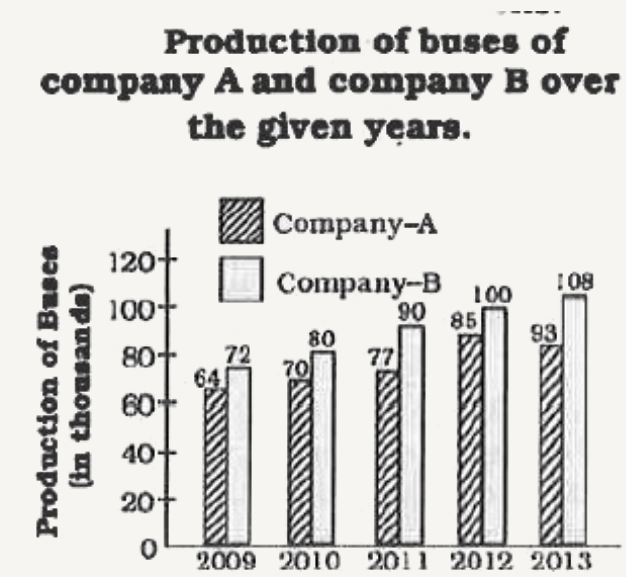
The average production (in thousand) of company A over the years 2010, 2011, 2012, 2013 isView SolutionDirections for questions : These questions are based on the following data. Read the following bar graph and answer the questions.
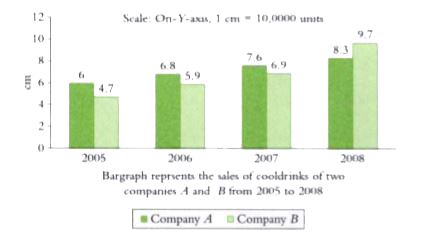
In year 2007 what is the difference between the sales of A and the sales of B ?View SolutionA watch company produced four different products. The sales of these products in lakhs during 2005 and 2010 are shown in the following bar diagram. Study the graph and answer the questions.
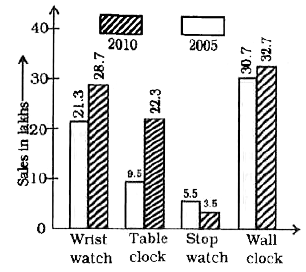
During the period 2005-2010 the minimum rate of increase in sales in the product ofView SolutionDirection : Study the following bar diagram carefully and answer the four questions.

The average production (in thousand) of company A over the years 2010, 2011, 2012, 2013 isView Solution

