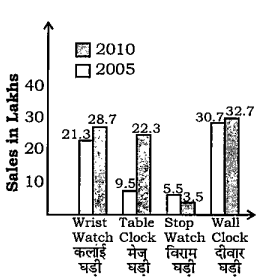
A watch company produces four different products. The sate of these products in lakhs during 2005 and 2010 are shown in the following bar diagram, Study the graph and answer the questions.
एक घड़ी कंपनी चार भिन्न उत्पाद बनाती है । इन उत्पादों की 2005 और 2010 में लाखें में बिक्री निम्मलिखित बार डायग्राम में दर्शायी गई है । ग्राफ का अध्ययन कीजिए और दिए गए प्रश्नों के उत्तर दीजिए ।
 <br>
The sales of table clock in 2005 was less than the sales of wall clock in 2005 is nearly by -
2005 में मेज घड़ी की बिक्री 2005 में दीवार घड़ी की बिक्री से लगभग कितने प्रतिशत कम हुई ?
0.7005
0.6905
0.6805
0.6205
Step by step video & image solution for A watch company produces four different products. The sate of these products in lakhs during 2005 and 2010 are shown in the following bar diagram, Study the graph and answer the questions. एक घड़ी कंपनी चार भिन्न उत्पाद बनाती है । इन उत्पादों की 2005 और 2010 में लाखें में बिक्री निम्मलिखित बार डायग्राम में दर्शायी गई है । ग्राफ का अध्ययन कीजिए और दिए गए प्रश्नों के उत्तर दीजिए । The sales of table clock in 2005 was less than the sales of wall clock in 2005 is nearly by - 2005 में मेज घड़ी की बिक्री 2005 में दीवार घड़ी की बिक्री से लगभग कितने प्रतिशत कम हुई ? by Maths experts to help you in doubts & scoring excellent marks in Class 14 exams.
Updated on:21/07/2023Topper's Solved these Questions
Similar Questions
There are 200 questions in a 3 h examination. Among 200 questions, 50 are from Mathematics, 100 are from GK and 50 are from Science. Ram spent twice as much time on each Mathematics question as for each other question. How many minutes did he spend on Mathematics questions ?
View SolutionWhen 335 is added to 5A7, the result is 8B2. 8B2 is divisible by 3. What is the largest possible value of A?
View SolutionStudy the following graph which shows the production (in thousand) of different items, and answer the questions. निम्नलिखित ग्राफ का अध्ययन कीजिए, जिन विभिन्न मदों का उत्पादन (हजार में) दर्शाया गया है तथा दिए गए प्रश्नों के उत्तर दीजिए। The total number of all products produced by the company in the year 2006 and 2008 together is:- कंपनी द्वारा वर्ष 2006 और 2008 में तेयार सभी उत्पादों को मिलाकर उनकी कुल संख्या कितनी है?
View SolutionThe following line diagram represents the yearly sales figure of a company in the years 2001-2010. Examine the diagram and answer the question. निम्नलिखित रेखा आरेख किसी कंपनी की वर्ष 2007-2010 के दौरान वार्षिक बिक्री के आंकड़ों को दर्शाता है। आरेख का अध्ययन करें और नीचे दिए गए प्रश्नों के उत्तर दें- The ratio of sales in 2002 to that in 2007 is वर्ष 2002 में बिक्री का वर्ष 2007 में बिक्री के साथ अनुपात है-
View SolutionThe following line diagram represents the yearly sales figure of a company in the years 2001-2010. Examine the diagram and answer the question. निम्नलिखित रेखा आरेख किसी कंपनी की वर्ष 2007-2010 के दौरान वार्षिक बिक्री के आंकड़ों को दर्शाता है। आरेख का अध्ययन करें और नीचे दिए गए प्रश्नों के उत्तर दें- The percentage increase in sales in the year 2005 with respect to the previous year is वर्ष 2005 में पिछले वर्ष की तुलना में बिक्री में वृद्धि का प्रतिशत है-
View SolutionThe following line diagram represents the yearly sales figure of a company in the years 2001-2010. Examine the diagram and answer the question. निम्नलिखित रेखा आरेख किसी कंपनी की वर्ष 2007-2010 के दौरान वार्षिक बिक्री के आंकड़ों को दर्शाता है। आरेख का अध्ययन करें और नीचे दिए गए प्रश्नों के उत्तर दें- ............................................................................................................................................. Total sales (in crore of Rs.) from 2005 to 2008 is वर्ष 2005 से वर्ष 2008 तक कुल बिक्री (रु. करोड में) है-
View SolutionThe bar graph provided below represents the production of rice and wheat in different states of a country in the certain year. Answer the questions based on the bar graph. नीचे दिये गया बार-ग्राफ एक निश्चित वर्ष में विभिन्न प्रदेशों में चावल और गेहूँ की उपज को दर्शाता है। इस ग्राफ पर आधारित प्रश्नों के उत्तर दें। The difference between the production in rice and wheat is maximum in- चावल की उपज और गेहूँ की उपज में अधि कतम अंतर है-
View SolutionThe following graph shows the sales of cars (in thousands) in four cities in 4 years. Study the graph and answer the questions.
निम्नलिखित आरेख 4 वर्षों में चार शहरों में कारों की बिक्री (हज़ार में) को दर्शाता है। इस आरेख का अध्ययन कीजिए तथा प्रश्नों के उत्तर दीजिए। In 2019, what is the average number of sales among all the four cities?
2019 में, सभी चार शहरों में औसत बिक्री कितनी रही है?
View SolutionIn the given bar graph, the Blue bar shows the income and the Red bar shows the expenditure of a company. Study the graph and answer the question that follows
दिए गए दंड आरेख में, नीला दंड एक कंपनी की आय दिखाता है और लाल दंड खर्च (लाख रुपये में) को दर्शाता है। आरेख का अध्ययन करें और उस प्रश्न का उत्तर दें जो नीचे पूछा गया है। The percentage decrease in the income of the company in 2002 as compared to that in 2001 is:
2001 की तुलना में 2002 में कंपनी की आय में कितने प्रतिशत में कमी आई है:
View SolutionA watch company produced four different products. The sales of these products in lakhs during 2005 and 2010 are shown in the following bar diagram. Study the graph and answer the questions.
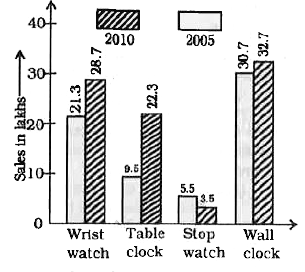
The sales in percentage of wrist watch in 2010 more than the sales of table clock in 2010 was nearly by
View SolutionA watch company produced four different products. The sales of these products in lakhs during 2005 and 2010 are shown in the following bar diagram. Study the graph and answer the questions.
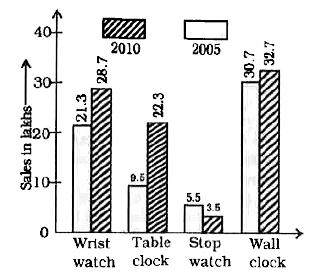
The ratio of sales of stop watch in 2010 to the sale of table clock in 2005 is
View SolutionA watch company produced four different products. The sales of these products in lakhs during 2005 and 2010 are shown in the following bar diagram. Study the graph and answer the questions.
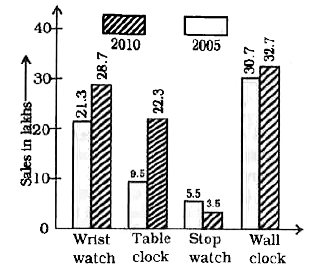
The sales of table clock in 2005 was less than the sales of wall clock in 2005 is nearly by
View SolutionA watch company produced four different products. The sales of these products in lakhs during 2005 and 2010 are shown in the following bar diagram. Study the graph and answer the questions.
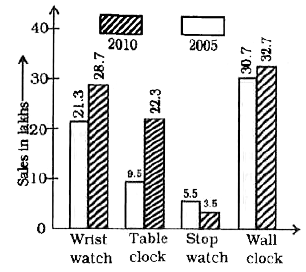
During the period 2005-2010 the minimum rate of increase in sales in the product of
View SolutionA watch company produced four different products. The sales of these products in lakhs during 2005 and 2010 are shown in the following bar diagram. Study the graph and answer the questions.
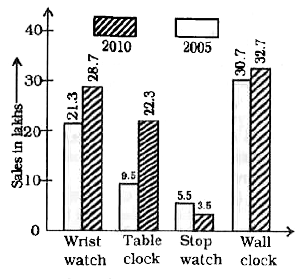
The sales have increased by nearly 135% from 2005 to 2010 in the product of
View SolutionA watch company manufactures four different products. The sales of these products in millions in 2005 and 2010 are shown in the following bar diagram What is the ratio of the sale of stop watch in 2010 to that of table watch in 2005?
View Solution
