A watch company produced four different products. The sales of these products in lakhs during 2005 and 2010 are shown in the following bar diagram. Study the graph and answer the questions.
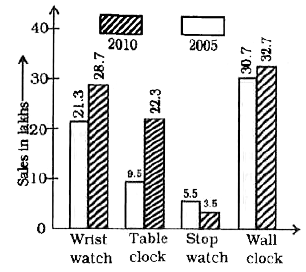
During the period 2005-2010 the minimum rate of increase in sales in the product of
Wrist watch/कलाई घड़ी
Table clock/मेज घड़ी
Stop watch/विराम घड़ी
Wall clock /दीवार घड़ी
Step by step video & image solution for A watch company produced four different products. The sales of these products in lakhs during 2005 and 2010 are shown in the following bar diagram. Study the graph and answer the questions. During the period 2005-2010 the minimum rate of increase in sales in the product of by Maths experts to help you in doubts & scoring excellent marks in Class 14 exams.
Topper's Solved these Questions
Similar Questions
A watch company produces four different products. The sate of these products in lakhs during 2005 and 2010 are shown in the following bar diagram, Study the graph and answer the questions.
एक घड़ी कंपनी चार भिन्न उत्पाद बनाती है । इन उत्पादों की 2005 और 2010 में लाखें में बिक्री निम्मलिखित बार डायग्राम में दर्शायी गई है । ग्राफ का अध्ययन कीजिए और दिए गए प्रश्नों के उत्तर दीजिए ।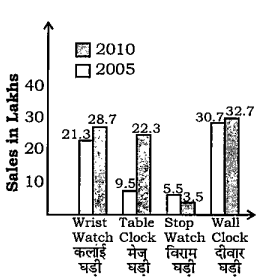 <br>
The sales of table clock in 2005 was less than the sales of wall clock in 2005 is nearly by -
2005 में मेज घड़ी की बिक्री 2005 में दीवार घड़ी की बिक्री से लगभग कितने प्रतिशत कम हुई ?View SolutionRead the graph and answer the following questions
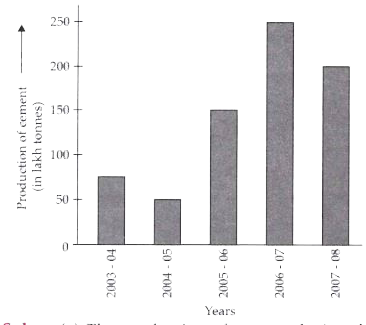
During which period, the production was minimum ?View Solution
Knowledge Check
- Question 1 - Select One
A watch company produced four different products. The sales of these products in lakhs during 2005 and 2010 are shown in the following bar diagram. Study the graph and answer the questions.
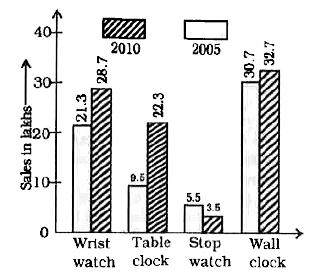
The ratio of sales of stop watch in 2010 to the sale of table clock in 2005 isA6:19B7:6C19:6D7:19 - Question 2 - Select One
A watch company produced four different products. The sales of these products in lakhs during 2005 and 2010 are shown in the following bar diagram. Study the graph and answer the questions.
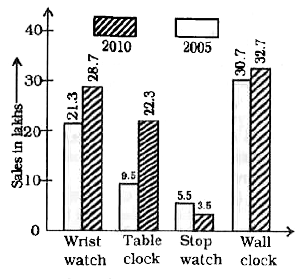
The sales have increased by nearly 135% from 2005 to 2010 in the product ofA(a) Table clockB(b) Wrist watchC(c) Stop watchD(d) Wall clock - Question 3 - Select One
A watch company produced four different products. The sales of these products in lakhs during 2005 and 2010 are shown in the following bar diagram. Study the graph and answer the questions.
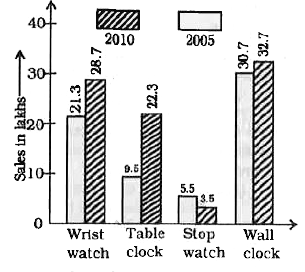
The sales in percentage of wrist watch in 2010 more than the sales of table clock in 2010 was nearly byA26.7%B27.7%C28.7%D21.7%
Study the graph and answer the questions.
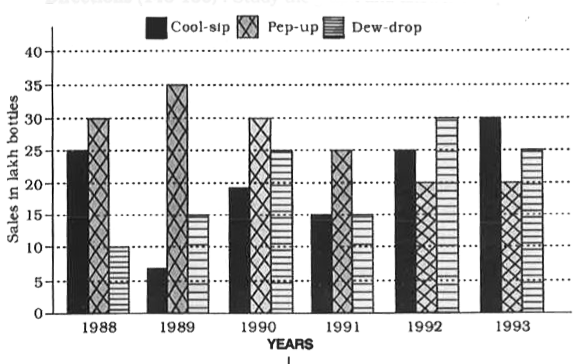
In case of which soft drink was the average annual sale minimum during the period 1988- 1993 ?View SolutionStudy the graph and answer the questions.
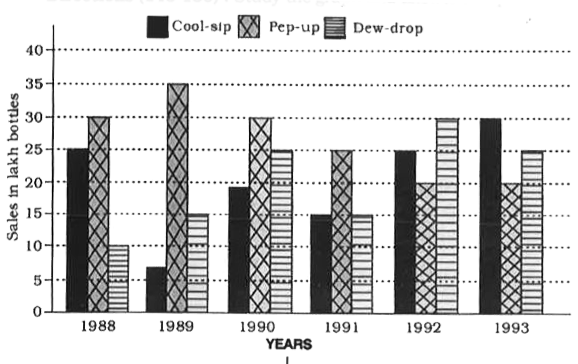
In case of which soft drink was the average annual sale maximum during the period 1988 - 1993 ?View SolutionA watch company produced four different products. The sales of these products in lakhs during 2005 and 2010 are shown in the following bar diagram. Study the graph and answer the questions.
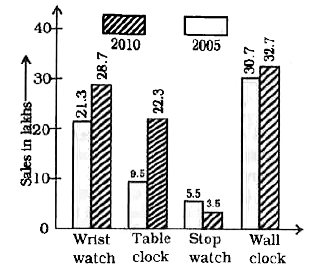
The sales of table clock in 2005 was less than the sales of wall clock in 2005 is nearly byView SolutionStudy the graph and answer the questions.

In case of which soft drink was the average annual sale minimum during the period 1988- 1993 ?View SolutionStudy the graph and answer the questions.
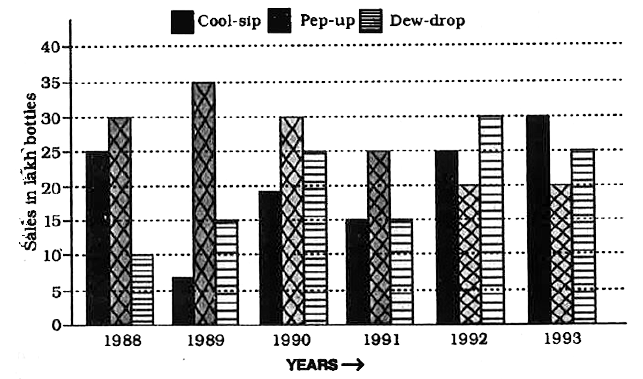
In case of which soft drink was the average annual sale maximum during the period 1988-1993 ?View Solution

