The pie-chart provided below gives the distribution of land (in a village) under various food crops. Study the pie-chart carefully and answer the questions.
नीचे दिए गए वृत्तारेखा में विभिन खाद्य फसलों के ( एक गाँव में ) भूमि का वितरण दिखाया गया हैं। वृत्तारेखा का अध्ययन कीजिए और प्रश्नों के उत्तर दीजिए।
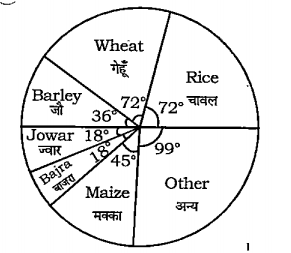 If the production of rice is 5 times that of jowar and the production of jowar is 2 times that of bazra, then the ratio between the yield per acre of rice and bazra is
यदि चावल का उत्पादन ज्वार का पांच गुना और ज्वार का उत्पादन बाजरे का दो गुना हो, तब चावल और बाजरे के प्रति एकड़ उत्पादन का अनुपात है-
5:2
3:1
4:3
6:5
Step by step video & image solution for The pie-chart provided below gives the distribution of land (in a village) under various food crops. Study the pie-chart carefully and answer the questions. नीचे दिए गए वृत्तारेखा में विभिन खाद्य फसलों के ( एक गाँव में ) भूमि का वितरण दिखाया गया हैं। वृत्तारेखा का अध्ययन कीजिए और प्रश्नों के उत्तर दीजिए। If the production of rice is 5 times that of jowar and the production of jowar is 2 times that of bazra, then the ratio between the yield per acre of rice and bazra is यदि चावल का उत्पादन ज्वार का पांच गुना और ज्वार का उत्पादन बाजरे का दो गुना हो, तब चावल और बाजरे के प्रति एकड़ उत्पादन का अनुपात है- by Maths experts to help you in doubts & scoring excellent marks in Class 14 exams.
Updated on:21/07/2023Topper's Solved these Questions
Similar Questions
The pie-chart provided below gives the distribution of land (in a village) under various food crops. Study the pie-chart carefully and answer the questions.
नीचे दिए गए वृत्तारेखा में विभिन खाद्य फसलों के ( एक गाँव में ) भूमि का वितरण दिखाया गया हैं। वृत्तारेखा का अध्ययन कीजिए और प्रश्नों के उत्तर दीजिए।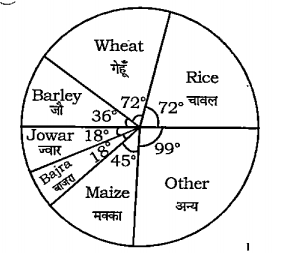 The ratio of the land used for rice and barley is
चावल और जौ के उत्पादन के लिए प्रयुक्त भूमि का अनुपात है-
View SolutionThe pie-chart provided below gives the distribution of land (in a village) under various food crops. Study the pie-chart carefully and answer the questions.
नीचे दिए गए वृत्तारेखा में विभिन खाद्य फसलों के ( एक गाँव में ) भूमि का वितरण दिखाया गया हैं। वृत्तारेखा का अध्ययन कीजिए और प्रश्नों के उत्तर दीजिए।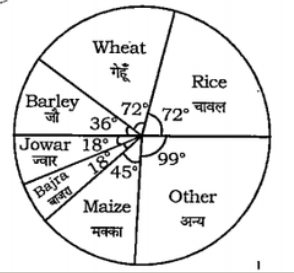 The combination of three crops which contribute to more than 60% of the total area under the food crops is
तीन फसलें जिनकी हिस्सेदारी कूल खाद्य फसलों के क्षेत्रफल में 60% से ज्यादा है-
View Solution
Knowledge Check
तताँरा के गाँव में किस पर्व का आयोजन किया गया?
Aहोली पर्व काBछठ पूजा पर्व काCपशु पर्व काDपुष्कर पर्व का
The pie-chart provided below gives the distribution of land (in a village) under various food crops. Study the pie-chart carefully and answer the questions.
नीचे दिए गए वृत्तारेखा में विभिन खाद्य फसलों के ( एक गाँव में ) भूमि का वितरण दिखाया गया हैं। वृत्तारेखा का अध्ययन कीजिए और प्रश्नों के उत्तर दीजिए।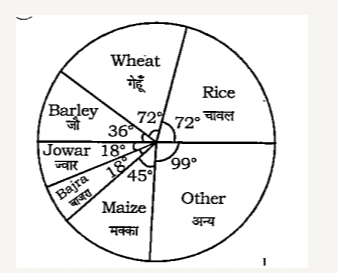 If 10% of the land reserved for rice be distributed to wheat and barley in the ratio 2 : 1, then the angle corresponding to wheat in the new pie-chart will be
यदि 10% चावल के लिए, संरक्षित भूमि गेहूँ और जौ के बीच 2: 1 में बांट दी जाए, तब गेहूँ के अंतर्गत नया कोण होगा-
View Solution(Questions 15-19): The pie-chart shown below gives the distribution of land in a village under various food crops. Study the pie-chart carefully and answer the questions that follow: Distribution of areas (in acres) under various food crops (FIGURE) Which combination of three crops contribute to 50% of the total area under the food crops? (a) Wheat, Barley and Jowar (b) Rice, Wheat and Jowar (c) Rice, What and Barley (d) Bajra, Maize and Rice
View SolutionIn the following table, the production of various crops (in tonnes) is given from 2015 to 2019. Study the table and answer the question that follows:
दी गयी तालिका में, 2015 से 2019 तक विभिन्न फसलों का उत्पादन (टन में ) दिया गया है | इस तालिका का अध्ययन करें तथा फिर पूछे गए प्रश्न का उत्तर दीजिए |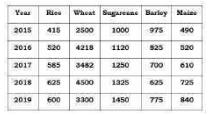 The difference (in tonnes) between the average production of barley and average production of rice is:
जौ के औसत उत्पादन तथा चावल के औसत उत्पादन के बीच क्या अंतर (टन में ) है?
View Solutionनीचे दिए गए शब्दों का वाक्य में प्रयोग कीजिए
View Solutionनीचे दिए गए शब्दों का वाक्यों में प्रयोग कीजिए
View SolutionIn the following table, the production of various crops (in tonnes) is given from 2015 to 2019. Study the table and answer the question that follows:
दी गयी तालिका में, 2015 से 2019 तक विभिन्न फसलों का उत्पादन (टन में ) दिया गया है | इस तालिका का अध्ययन करें तथा फिर पूछे गए प्रश्न का उत्तर दीजिए |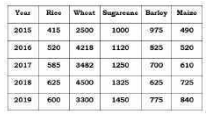 The highest growth of sugarcane production over its previous year is recorded in the year:/
किस वर्ष गन्ने का उत्पादन पिछले वर्ष की तुलना में अधिकतम रहा है ?
View SolutionIn the following table, the production of various crops (in tonnes) is given from 2015 to 2019. Study the table and answer the question that follows:
दी गयी तालिका में, 2015 से 2019 तक विभिन्न फसलों का उत्पादन (टन में ) दिया गया है | इस तालिका का अध्ययन करें तथा फिर पूछे गए प्रश्न का उत्तर दीजिए |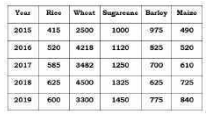 The percentage growth of maize in the year 2019 over the year 2015 is: (correct to one decimal place)
वर्ष 2019 में वर्ष 2015 की तुलना में मक्का के उत्पादन में कितने प्रतिशत की वृद्धि हुई है ? ( दशमलव के एक स्थान तक )
View Solution
