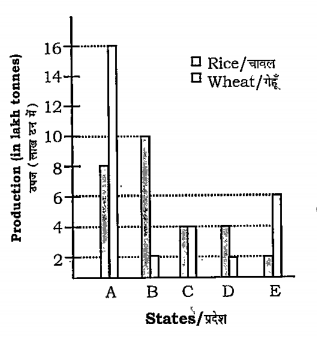
The bar graph provided below represents the production of rice and wheat in different states of a country in the certain year. Answer the questions based on the bar graph.
नीचे दिये गया बार-ग्राफ एक निश्चित वर्ष में विभिन्न प्रदेशों में चावल और गेहूँ की उपज को दर्शाता है। इस ग्राफ पर आधारित प्रश्नों के उत्तर दें।
 The total production of rice and wheat in all the mentioned states in minimum in the state.
दिये गये सभी प्रदेशों में से किस प्रदेश में चावल व गेहूँ को कुल उपज सबसे कम है?
B
C
D
E
Step by step video & image solution for The bar graph provided below represents the production of rice and wheat in different states of a country in the certain year. Answer the questions based on the bar graph. नीचे दिये गया बार-ग्राफ एक निश्चित वर्ष में विभिन्न प्रदेशों में चावल और गेहूँ की उपज को दर्शाता है। इस ग्राफ पर आधारित प्रश्नों के उत्तर दें। The total production of rice and wheat in all the mentioned states in minimum in the state. दिये गये सभी प्रदेशों में से किस प्रदेश में चावल व गेहूँ को कुल उपज सबसे कम है? by Maths experts to help you in doubts & scoring excellent marks in Class 14 exams.
Topper's Solved these Questions
Similar Questions
Each question has four options(A), (B), (C) and (D) for answers. Select the right answer and write in English letters in the box against each question in the enclosed answer sheet.
A General, while arranging his men, who were 6000 in number, in the form of a square, found that there were 71 men left over. How many were arranged in each row?02:38View SolutionThere are 200 questions in a 3 h examination. Among 200 questions, 50 are from Mathematics, 100 are from GK and 50 are from Science. Ram spent twice as much time on each Mathematics question as for each other question. How many minutes did he spend on Mathematics questions ?
02:11View SolutionRead the following bar graph and answer the following questions: What information is given by the bar graph? Which state is the largest producer of rice? Which state is the largest producer of wheat? Which state has total production of rice and wheat as its maximum? Which state has the total production of wheat and rice minimum?
02:45View SolutionDetermine the point of symmetry of a regular hexagon.
02:17View SolutionMatch the following Column A to Column B
 05:41View Solution
Match the following Column A to Column B
 02:10View Solution
Match the following Column A to Column B
 02:17View Solution
The inequation represented by the graph given below is :
02:10View SolutionThe inequation that best describes the graph given below is _________
03:02View SolutionThe inequation that best describes the following graph is _________
02:10View SolutionIn the given figure, PQRS is a parallelogram. A and B are the mid-point of ¯¯¯¯¯¯PQ and ¯¯¯¯¯SR respectively. If PS=BR, then the quadrilateral ADBC is a…………………… ,
ltimg src="https://d10lpgp6xz60nq.cloudfront.net/physics_images/PS_MATH_IX_C12_E05_020_Q01.png" width="80%"gt03:01View SolutionRead the following bar graph and answer the following questions: What information is given by the bar graph? Which state is the largest producer of rice? Which state is the largest producer of wheat? Which state has total production of rice and wheat as its maximum? Which state has the total production of wheat and rice minimum?
01:25View SolutionThe bar graph provided below represents the production of rice and wheat in different states of a country in the certain year. Answer the questions based on the bar graph. नीचे दिये गया बार-ग्राफ एक निश्चित वर्ष में विभिन्न प्रदेशों में चावल और गेहूँ की उपज को दर्शाता है। इस ग्राफ पर आधारित प्रश्नों के उत्तर दें। The ratio of total production of rice in the mentioned states to that of wheat in those states, is दिये गये प्रदेशों में चावल की कुल उपज का गेहूँ की कुल उपज से अनुपात है-
02:11View SolutionThe bar graph provided below represents the production of rice and wheat in different states of a country in the certain year. Answer the questions based on the bar graph. नीचे दिये गया बार-ग्राफ एक निश्चित वर्ष में विभिन्न प्रदेशों में चावल और गेहूँ की उपज को दर्शाता है। इस ग्राफ पर आधारित प्रश्नों के उत्तर दें। The difference between the production in rice and wheat is maximum in- चावल की उपज और गेहूँ की उपज में अधि कतम अंतर है-
04:32View SolutionThe bar graph provided below represents the production of rice and wheat in different states of a country in the certain year. Answer the questions based on the bar graph. नीचे दिये गया बार-ग्राफ एक निश्चित वर्ष में विभिन्न प्रदेशों में चावल और गेहूँ की उपज को दर्शाता है। इस ग्राफ पर आधारित प्रश्नों के उत्तर दें। The average of production of rice in the mentioned states (in lakh tonnes) is दिये गये प्रदेशों में चावल की उपज का औसत (लाख टनों में) है-
02:22View Solution

