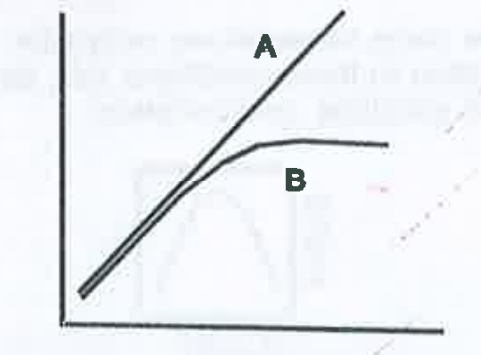
The same enzyme catalyzed reaction showed two different kinetic patterns as shown in the graph. Y-axis indicates product formed and X-axis indicates time. Mark the correct interpretation.
 Solution in Kannada
Reaction A is carried out at higher tempreature than B
Reaction B is carried out at a pH higher than that for reaction A.
Substrate in replenished form time to time in reaction A and not in B
Only reaction A is carried out at optimum concentration
The correct Answer is:C
Step by step video & image solution for The same enzyme catalyzed reaction showed two different kinetic patterns as shown in the graph. Y-axis indicates product formed and X-axis indicates time. Mark the correct interpretation. by Biology experts to help you in doubts & scoring excellent marks in Class 11 exams.
Updated on:21/07/2023Topper's Solved these Questions
- ANIMAL TISSUES BOOK - TRUEMAN BIOLOGYCHAPTER - ANIMAL TISSUES EXERCISE - MULTIPLE CHOICE QUESTIONS
194 Videos
- CELL- THE BASIC UNIT OF LIFE ( CELL AND ITS STRUCTURAL ORGANISATION )BOOK - TRUEMAN BIOLOGYCHAPTER - CELL- THE BASIC UNIT OF LIFE ( CELL AND ITS STRUCTURAL ORGANISATION )EXERCISE - MULTIPLE CHOICE ANSWER TYPE
311 Videos
Similar Questions
Who established Histology as a separate
branch of Zoology ?
View SolutionAn example of enucleated living plant cell is
View Solution(a) The distance time graph of a body is parallel to the time axis. What does it indicate ? (b) The distance time graph of a body coincide with time axis. What does it indicate ?
View SolutionWhich of the following graphs correctly indicates the reaction in presence (indicated bt +) and absence (indicated as -) of an enzyme ?
View SolutionWhich of the following graphs correctly indicates the reaction in presence (indicated bt +) and absence (indicated as -) of an enzyme ?
View SolutionIn a graph of population, on x-axis time and on y-axis population is plotted. A parallel line to x-axis shows:
View SolutionFor shown situation draw a graph showing acceleration of A and B on y-axis and time on x-axis (g=10ms^(-2))
View SolutionFor shown situation draw a graph showing accelerations of A and B on y-axis and time of x-axis. (g=10ms^(-2))
View SolutionIn a graph of population, on x-axis time and on y-axis population is plotted. A parallel line to x-axis shows:
View Solution
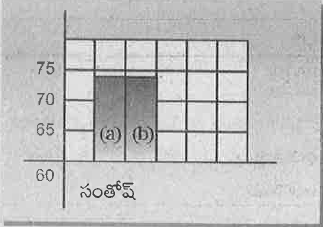
ఈ గ్రాఫ్ తెలియజేసే అంశం X - అక్షం : విద్యార్థి పేరు Y - అక్షం : హృదయస్పందన, నాడీ స్పందన నిముషానికి
View SolutionX- అక్షంను సూచించునది ( )
View SolutionY- అక్షంను సూచించునది ( )
View SolutionWhich of the following graphs correctly indicates the reaction in presence (indicated bt +) and absence (indicated as -) of an enzyme ?
View SolutionWhich of the following graphs correctly indicates the reaction in presence (indicated bt +) and absence (indicated as -) of an enzyme ?
View SolutionThe same enzyme catalyzed reaction showed tow differenet kinetic patterns as shown in the graph. Y-axis indicates prouduct formed and X-axis indicates time. Mark the correct interpretation.

View Solution
