Draw a pie chart for the given data.
Favourite foodNumber of peopleNorth Indian 30South Indian40Chinese25Others25
Step by step video & image solution for Draw a pie chart for the given data. {:("Favourite food","Number of people"),("North Indian ",30),("South Indian",40),("Chinese",25),("Others",25):} by Maths experts to help you in doubts & scoring excellent marks in Class 8 exams.
Updated on:21/07/2023Topper's Solved these Questions
- DATA HANDLINGBOOK - NCERT EXEMPLARCHAPTER - DATA HANDLINGEXERCISE - THINK AND DISCUSS
2 Videos
- DATA HANDLINGBOOK - NCERT EXEMPLARCHAPTER - DATA HANDLINGEXERCISE - EXERCISE (Choose the correct answer )
35 Videos
- COMPARING QUANTITIESBOOK - NCERT EXEMPLARCHAPTER - COMPARING QUANTITIESEXERCISE - Think and Discuss
2 Videos
- DIRECT AND INVERSE PROPORTIONS BOOK - NCERT EXEMPLARCHAPTER - DIRECT AND INVERSE PROPORTIONS EXERCISE - THINK AND DISCUSS
2 Videos
Similar Questions
The following data represents the approximate percentage of water in various oceans. Prepare a pie chart for the given data.
Pacific40%Atlantic30%Indian20%Others10%
View SolutionThe following table shows the household expenditure of family on different items. Draw a pie chart to represent the given data.
ItemRentFoodClotingEducationOthersExpenditure25%30%10%15%20%
View Solution
Knowledge Check
Find the median of the following data.
Class Intervalf 0−1012 10−2013 20−3025 30−4020 40−5010A25B23C24D26
The following table shows the favourite games of 240 students of a school. Draw a pie chart for the following data.
¯¯¯¯¯¯¯¯¯¯¯¯¯¯¯¯¯¯¯¯¯¯¯¯¯¯¯¯¯¯¯¯¯¯¯¯¯¯¯¯¯¯¯¯¯¯¯¯¯¯¯¯¯¯¯¯¯¯¯¯¯¯¯¯¯¯¯¯¯¯¯¯¯¯¯¯¯¯¯¯¯¯¯¯¯¯¯¯¯¯¯¯¯¯¯¯¯¯¯¯¯¯¯¯¯¯¯¯¯¯¯¯¯¯¯¯¯¯¯¯Game Football Badminton Criket Volleyball HockeyNumber of 35 30 80 40 55students ––––––––––––––––––––––––––––––––––––––––––––––––––––––––––––––––––––––––––––––
View SolutionThe following table shows various sports played by students in a school. Draw a pie chart to represent the given data.
SportsChessCricketCarromsFootballNumber of students35704263
View SolutionThe following table shows the percentage of people having different blood groups. Draw a pie chart to represent the given data.
Blood groupABCDPercentage of people20452015
View SolutionConstruct Consumer Price Index Number with the help of the following data:
ItemsPriceWeightFood 125 40Fuel 120 10Cloth 66.67 25House Rent 120 15Miscellaneous 150 10
View SolutionDraw the frequency polygon for the following data by drawing a histogram:
Class Intervalf 0−510 5−1020 10−1515 15−2030 20−2532 25−3044
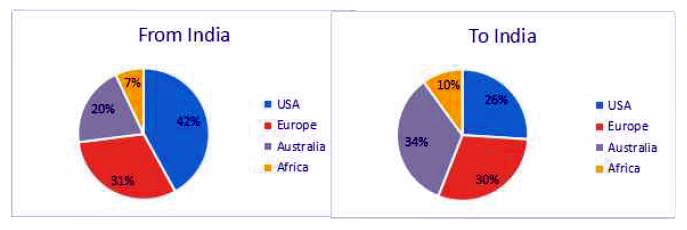
View SolutionThe given pie-chart shows the numbers of tourists for the year 2015. traveling from India and to India.

In the given pie-chart, if the number of tourists visiting India is 21,35,600 and the number from India to other countries is 20,45,450, how many more people visited USA from India than from USA to India?
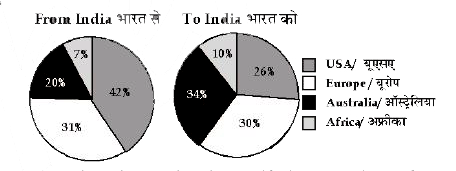
View SolutionThe given pie chart shows the number of tourists for the year 2015 travelling from India and to India

In the given pie chart, if the number of tourists visiting india is 2135600 and the number from India to other countries is 2045450 how more people visited USA from India than from USA to india?
View Solution
