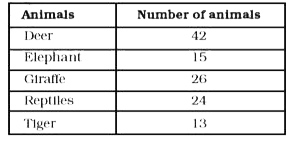
The following data represents the different number of animals in a zoo. Prepare a pie chart for the given data.

Step by step video & image solution for The following data represents the different number of animals in a zoo. Prepare a pie chart for the given data. by Maths experts to help you in doubts & scoring excellent marks in Class 8 exams.
Updated on:21/07/2023Topper's Solved these Questions
- DATA HANDLINGBook:NCERT EXEMPLARChapter:DATA HANDLINGExercise:EXERCISE (True or False)
Explore 23 Videos
- COMPARING QUANTITIESBook:NCERT EXEMPLARChapter:COMPARING QUANTITIESExercise:Think and Discuss
Explore 2 Videos
- DIRECT AND INVERSE PROPORTIONS Book:NCERT EXEMPLARChapter:DIRECT AND INVERSE PROPORTIONS Exercise:THINK AND DISCUSS
Explore 2 Videos
Similar Questions
The following data represents the approximate percentage of water in various oceans. Prepare a pie chart for the given data.
Pacific40%Atlantic30%Indian20%Others10%
View SolutionThe following table shows the favourite games of 240 students of a school. Draw a pie chart for the following data.
¯¯¯¯¯¯¯¯¯¯¯¯¯¯¯¯¯¯¯¯¯¯¯¯¯¯¯¯¯¯¯¯¯¯¯¯¯¯¯¯¯¯¯¯¯¯¯¯¯¯¯¯¯¯¯¯¯¯¯¯¯¯¯¯¯¯¯¯¯¯¯¯¯¯¯¯¯¯¯¯¯¯¯¯¯¯¯¯¯¯¯¯¯¯¯¯¯¯¯¯¯¯¯¯¯¯¯¯¯¯¯¯¯¯¯¯¯¯¯¯Game Football Badminton Criket Volleyball HockeyNumber of 35 30 80 40 55students ––––––––––––––––––––––––––––––––––––––––––––––––––––––––––––––––––––––––––––––
View SolutionThe following table shows various sports played by students in a school. Draw a pie chart to represent the given data.
SportsChessCricketCarromsFootballNumber of students35704263
View SolutionThe following data shows the expenditure of a person on different items during a month. Represent the data by a pie-chart. Items of expenditure, Rent, Education, Food, Clothing, Others Amount (in Rs.), 2700, 1800, 2400, 1500, 2400
View SolutionDraw a pictograph for representing the number of students in each class based on the given data.

View SolutionIn a district, the number of branches of different banks is given below:

Draw a pie chart for this data.
View SolutionIn the time table of a school, periods allotted per week to different teaching subjects are given below:

Draw a pie chart for this data.
View SolutionThe following table shows the percentage of people having different blood groups. Draw a pie chart to represent the given data.
Blood groupABCDPercentage of people20452015
View SolutionThe following table shows the household expenditure of family on different items. Draw a pie chart to represent the given data.
ItemRentFoodClotingEducationOthersExpenditure25%30%10%15%20%
View SolutionThe names and numbers of animals in a certain zoo are given below. Use the data to make a bar graph :

View Solution