A financial counselor gave a client this pie chart describing how to budget his income. If the client brings home Rs. 50,000 each month, how much should he spend in each category?
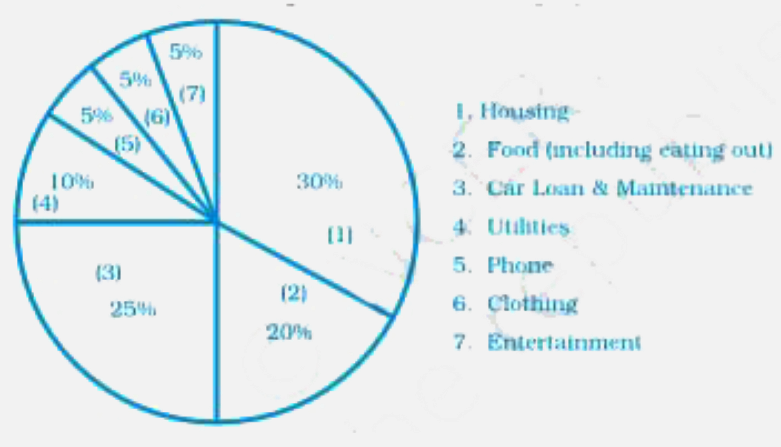
Step by step video & image solution for A financial counselor gave a client this pie chart describing how to budget his income. If the client brings home Rs. 50,000 each month, how much should he spend in each category? by Maths experts to help you in doubts & scoring excellent marks in Class 8 exams.
Updated on:21/07/2023Topper's Solved these Questions
- DATA HANDLINGBOOK - NCERT EXEMPLARCHAPTER - DATA HANDLINGEXERCISE - EXERCISE (True or False)
23 Videos
- COMPARING QUANTITIESBOOK - NCERT EXEMPLARCHAPTER - COMPARING QUANTITIESEXERCISE - Think and Discuss
2 Videos
- DIRECT AND INVERSE PROPORTIONS BOOK - NCERT EXEMPLARCHAPTER - DIRECT AND INVERSE PROPORTIONS EXERCISE - THINK AND DISCUSS
2 Videos
Similar Questions
Ajay buys 8 cookies consting Rs. Each. If the gives the shopkeepr Rs. 50, how much change he gest back?
View SolutionThe pie chart, given here, shows the amount of money spent on various sports by a school administration in a particular year.
Observe the pie chart and answer the questions based on this graph
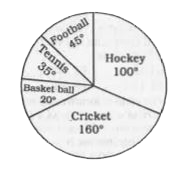
If the money spent on football was Rs. 9,000 how much more money was spent on hockey than on football ?
View Solution
Knowledge Check
The pie chart drawn below shows the spendings of a country on various sports during a particular year. Study the pie chart and answer the questions.
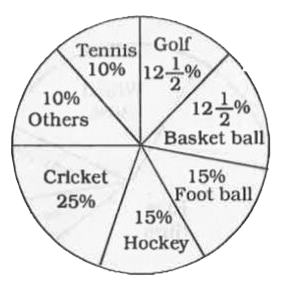
If, the total amount spent on sports during the year was Rs. 1,20,00,000, how much was spent on basketball ?ARs. 950000BRs. 10,00,000CRs. 12,00,000DRs. 15,00,000The given pie chart shows the monthly expenditure on various items and monthly savings of a household. The same distribution is followed for all the months of the year.
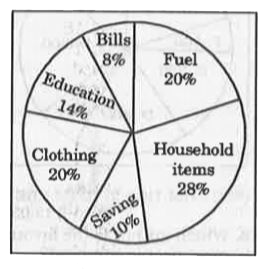
If monthly income is Rs. 50000, then how much is spent (in Rs.) on fuel?A12000B10000C13500D15000The given pie chart shows the monthly expenditure on various items and monthly savings of a household. The same distribution is followed for all the months of the year.

If monthly income is Rs. 50000, then how much is spent (in Rs.) on fuel?A12000B10000C13500D15000
Kaushal spends 2% more on the food than what he spends on the education of his son. If he spends Rs 1224 on the food,how much does he spend on the education of his son?
View SolutionThe following pie-chart shows the monthly expenditure of a man on various items. If he spends Rs. 16,000 per month, answer the following questions.
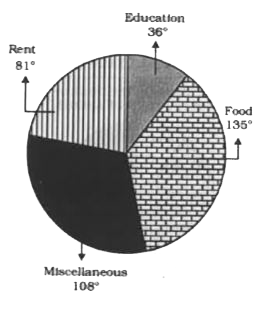
The amount he spends on education is:
View SolutionA man saves 36% of his income in 9 months. If he wants to save the same amount in 6 months, then by how much percentage should he increase his monthly savings?
View SolutionStudy the chart and answer the question based, on the pie chart.
The pie chart given below shows expenditures incurred by a family on various items and savings in a month. Savings of the family is month. Savings of the family is ₹ 8,000 in a month.
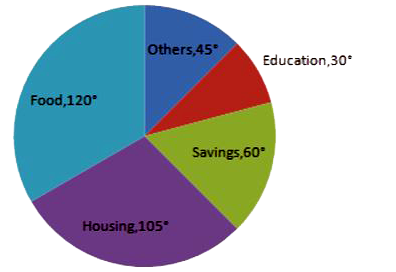
How much more amount is spent on food than on housing ?
View SolutionA man saves 30% of his income in 1 year. If he wants to save the same amount in 8 months, then by how much percentage should he increase his monthly savings?
View Solution
