Following is a pie chart showing the amount spent in rupees (in thousands) by a company on various modes of advertising for a product.
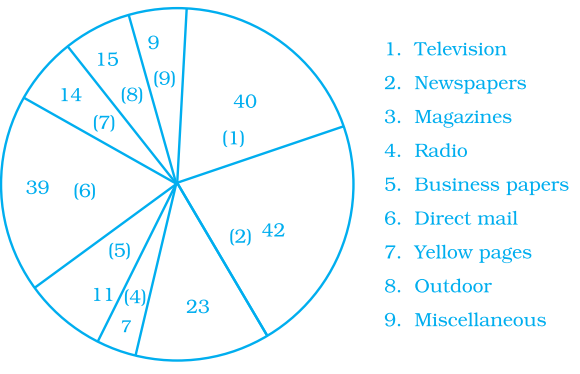
Which type of media advertising is the greatest amount of the total?
Step by step video & image solution for Following is a pie chart showing the amount spent in rupees (in thousands) by a company on various modes of advertising for a product. Which type of media advertising is the greatest amount of the total? by Maths experts to help you in doubts & scoring excellent marks in Class 8 exams.
Updated on:21/07/2023Topper's Solved these Questions
- DATA HANDLINGBOOK - NCERT EXEMPLARCHAPTER - DATA HANDLINGEXERCISE - EXERCISE (True or False)
23 Videos
- COMPARING QUANTITIESBOOK - NCERT EXEMPLARCHAPTER - COMPARING QUANTITIESEXERCISE - Think and Discuss
2 Videos
- DIRECT AND INVERSE PROPORTIONS BOOK - NCERT EXEMPLARCHAPTER - DIRECT AND INVERSE PROPORTIONS EXERCISE - THINK AND DISCUSS
2 Videos
Similar Questions
Following is a pie chart showing the amount spent in rupees (in thousands) by a company on various modes of advertising for a product.
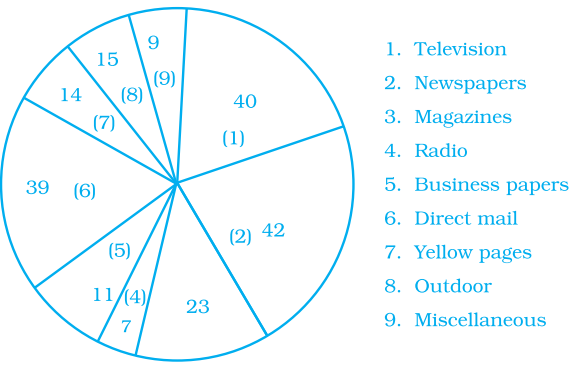
Which type of media advertising is the least amount of the total?
View SolutionFollowing is a pie chart showing the amount spent in rupees (in thousands) by a company on various modes of advertising for a product.
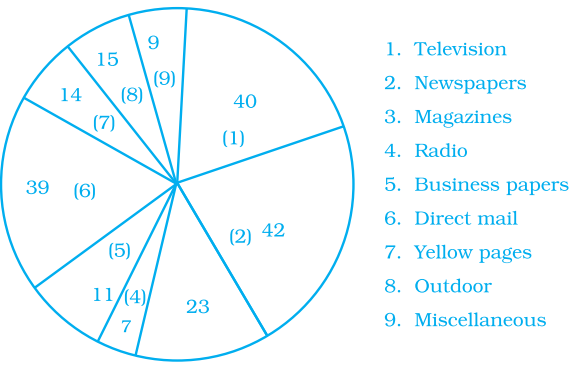
What per cent of the total advertising amount is spent on direct mail campaigns?
View Solution
Knowledge Check
The following graph gives the amount of manure (in thousand tonnes) manufactured by a company during some years.
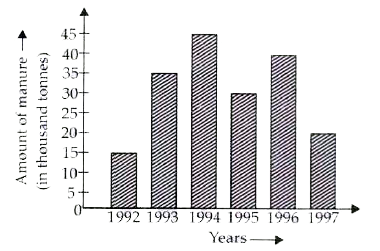
In which year the amount of manure manufactured by the company was maximum?A1993B1994C1996D1997
Following is a pie chart showing the amount spent in rupees (in thousands) by a company on various modes of advertising for a product.
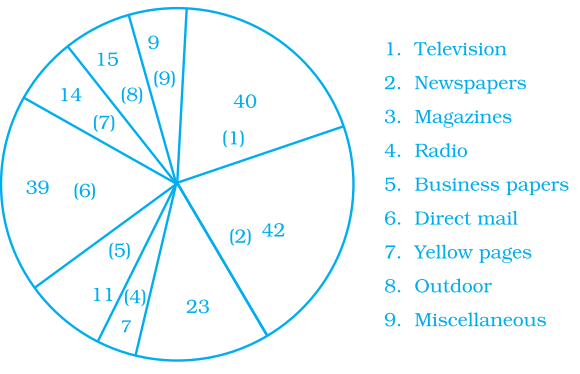
What per cent of the advertising amount is spent on newspaper and magazine advertisements?
View SolutionFollowing is a pie chart showing the amount spent in rupees (in thousands) by a company on various modes of advertising for a product.
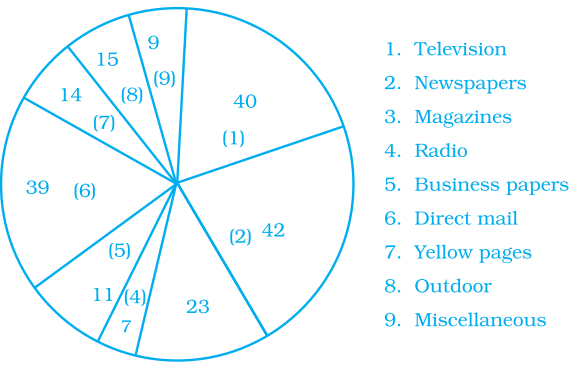
What media types do you think are included in miscellaneous? Why aren't those media types given their own category?
View SolutionFollowing is the pie-chart showing the spendings of a family on various items in a particular year
Study the pie chart and answer questions.
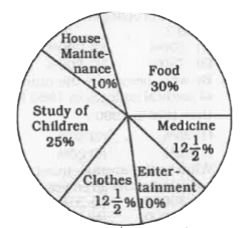
The ratio of the total amount spent for food and medicine is
View SolutionFollowing is the pie-chart showing the spendings of a family on various items in a particular year
Study the pie chart and answer questions.
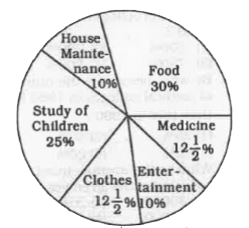
If the total amount spent on the family during the year was Rs 35,000, the amount spent for study of children and food together was
View SolutionFollowing is the pie-chart showing the spendings of a family on various items in a particular year
Study the pie chart and answer questions.
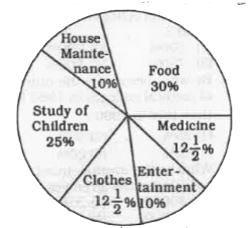
If the difference in the amount spent for buying clothes and house maintenance was Rs 1,500, how much they spent for house maintenance ?
View SolutionDirection :- Following is the pie-chart showing the spendings of a family on various items in a particular year Study the pie chart and answer questions.
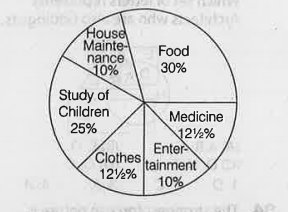 If the total amount spet on the family during the year was Rs. 35000, then the amount spent for stud of children and food together was (A) Rs. 19250 (B) Rs. 19500 (C) Rs.19750 (D) Rs. 19850
View SolutionThe given pie chart shows the amount of money spent by a school on various sports in the year 2015.
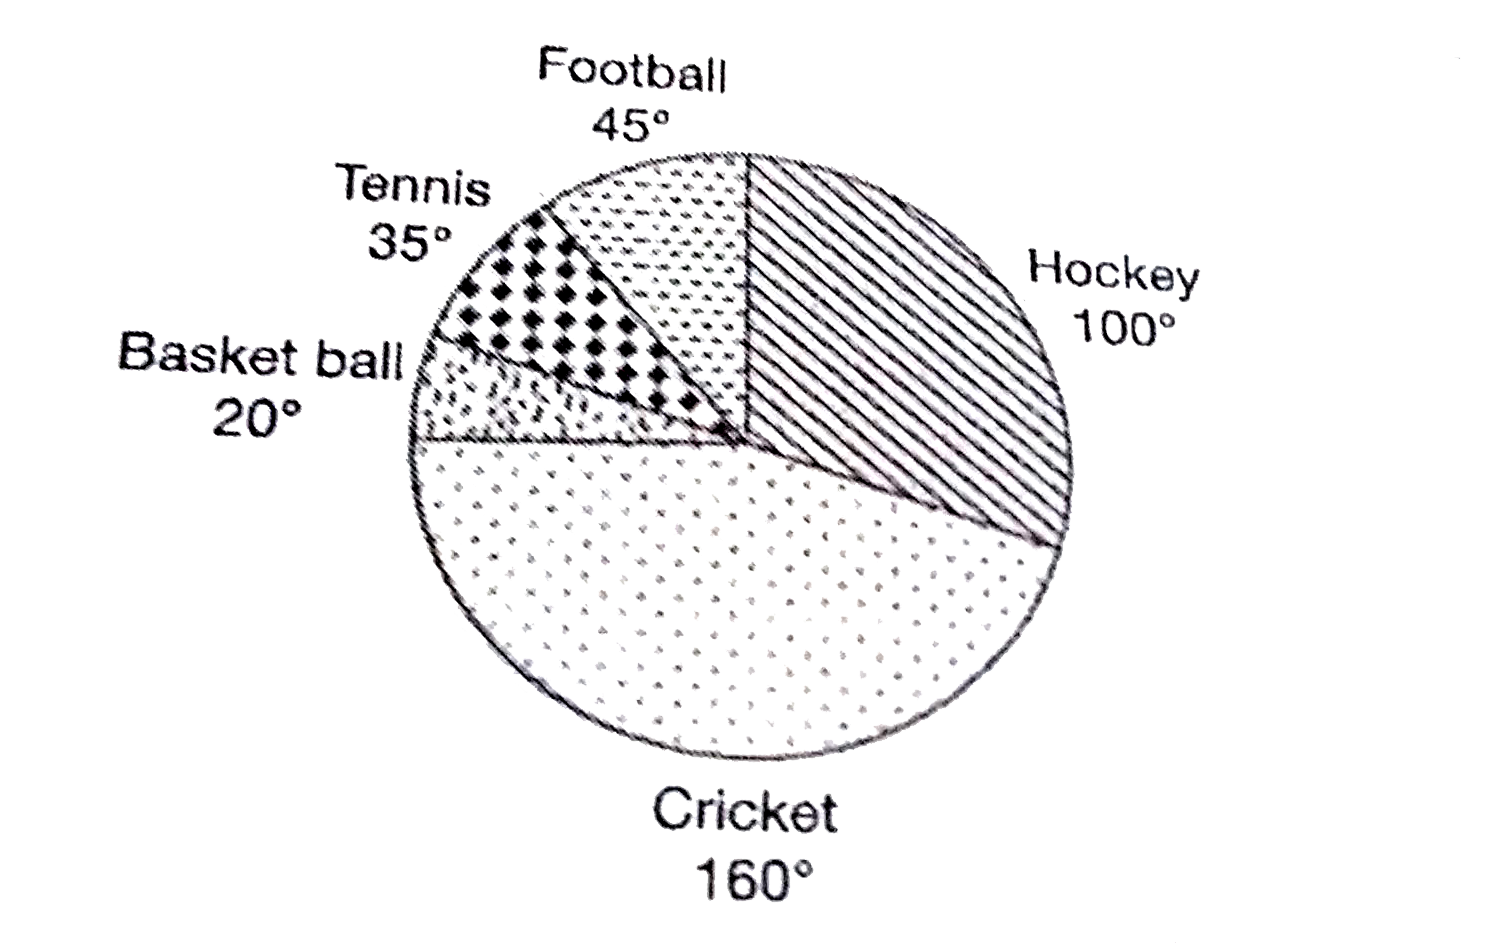
Study the pie chart carefully and answer the following question.
(i) If the amount spent on football was Rs. 9000, then how much more money was spent on hockey than on football ?
(ii) If the amount spent on football Rs. 9000, then what was the total amount spent on all sports ?
View Solution
