The given graph shows Nisha’s trip to a mall by a car. Observe the graph carefully and find what was she doing between 5 pm and 7 pm?
Driving to the mall.
Driving back home.
Was not driving.
Not enough data to answer
The correct Answer is:C
Step by step video, text & image solution for The given graph shows Nisha’s trip to a mall by a car. Observe the graph carefully and find what was she doing between 5 pm and 7 pm? by Maths experts to help you in doubts & scoring excellent marks in Class 8 exams.
Topper's Solved these Questions
- BOOK - NCERT EXEMPLARCHAPTER - INTRODUCTION TO GRAPHS EXERCISE - THINK AND DISCUSS4videos
INTRODUCTION TO GRAPHS
- BOOK - NCERT EXEMPLARCHAPTER - INTRODUCTION TO GRAPHS EXERCISE - EXERCISE86videos
INTRODUCTION TO GRAPHS
- BOOK - NCERT EXEMPLARCHAPTER - EXPONENTS AND POWERSEXERCISE - EXERCISE195videos
EXPONENTS AND POWERS
- BOOK - NCERT EXEMPLARCHAPTER - LINEAR EQUATIONS IN ONE VARIABLEEXERCISE - THINK AND DISCUSS3videos
LINEAR EQUATIONS IN ONE VARIABLE
Similar Questions
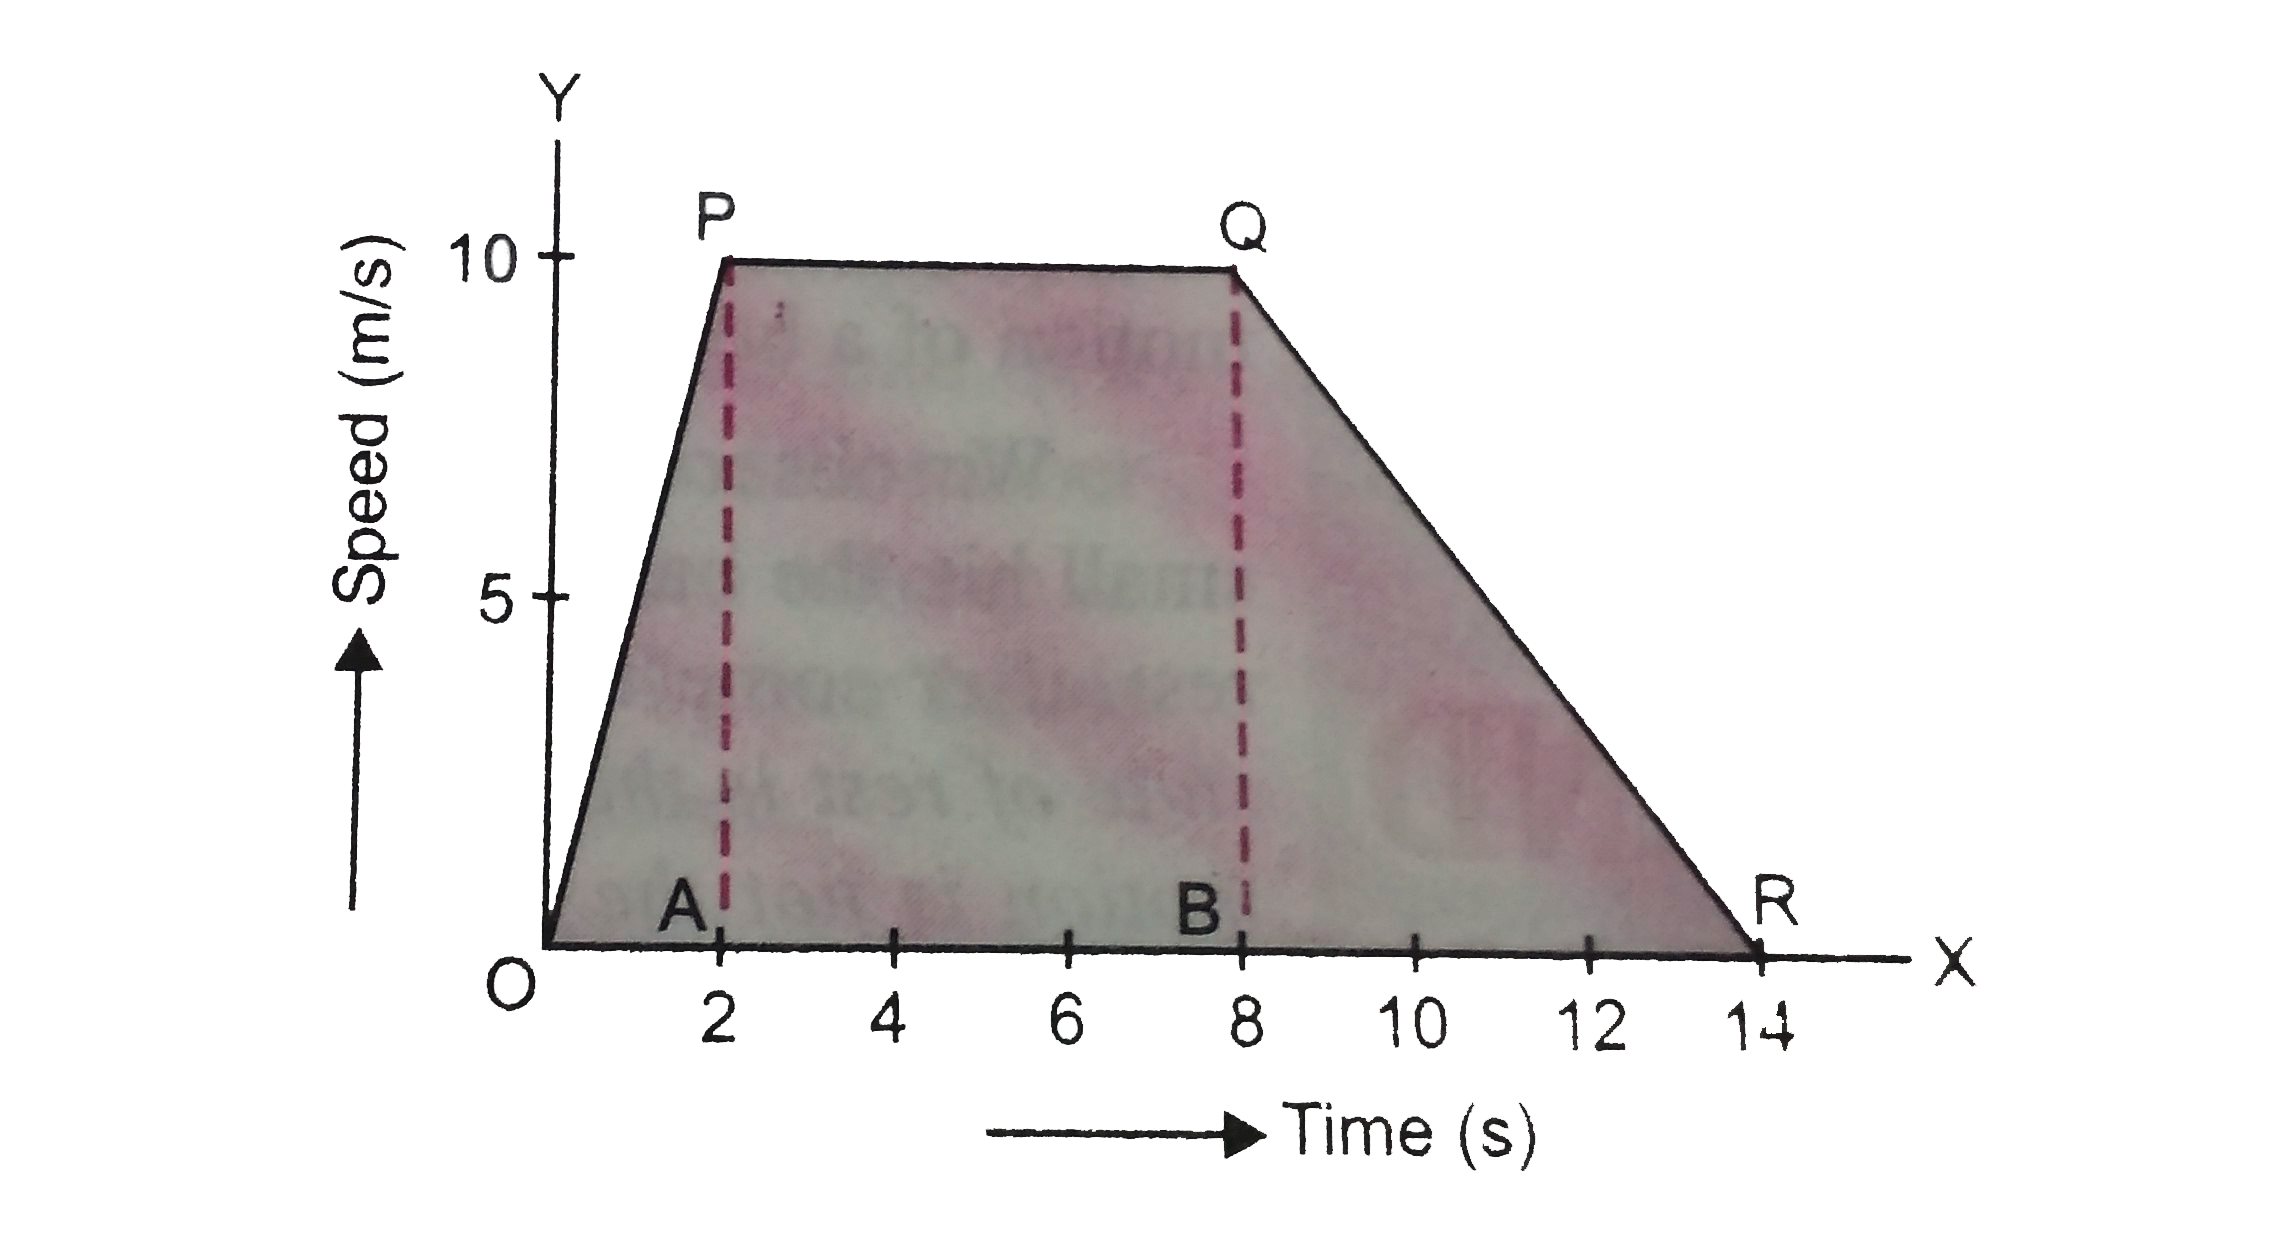
The speed time graph of a body is shown in Figure. Observer the graph carefully and answer the following :
(i) What kinds of motion are represented by OP,PQ and QR ?
(ii) Calculate acceleration of the body for the first 2sec.
(iii) Calculate retardation of body from 8s to 14s.
 View Solution
The double bar graph given below compares the class-averages in half yearly and annual examinations of 5 sections of Class VII.
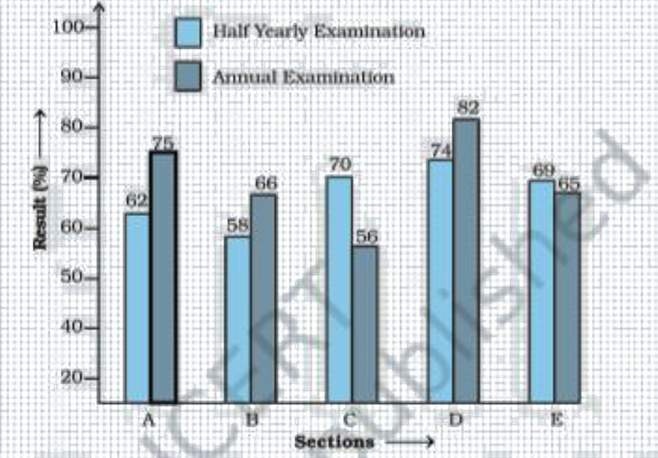
Observe the graph carefully and tell which section showed the most improvement and by how much?View Solution
Knowledge Check
- Question 1 - Select One
The circle - graph given here shows the spendings of a country on various sports during a prticular year. Study the graph carefully and answer the questions given below It .
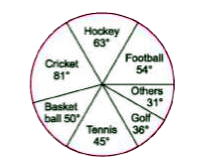
What per cent of the total spendings is Sent on Tennis ?A1212 %B2212 %C0.25D0.45 - Question 2 - Select One
The circle graph given here shows the spendings of a country on various sports during a particular year, study the graph carefully and answer the questions given below it.
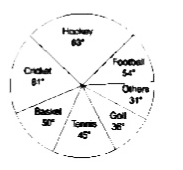
What per cent of the total spendings is spent on tennis ?A1212%B2212%C25%D45% - Question 3 - Select One
Study the following graph carefully and answer the question given below-----
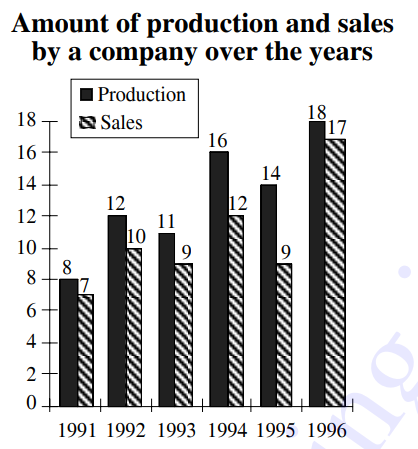
What was the difference between the sales of 1992 and 1995 ?A10 lakh tonnesB50 thousand tonnesC1 lakh tonnesD75 thousand tonnes
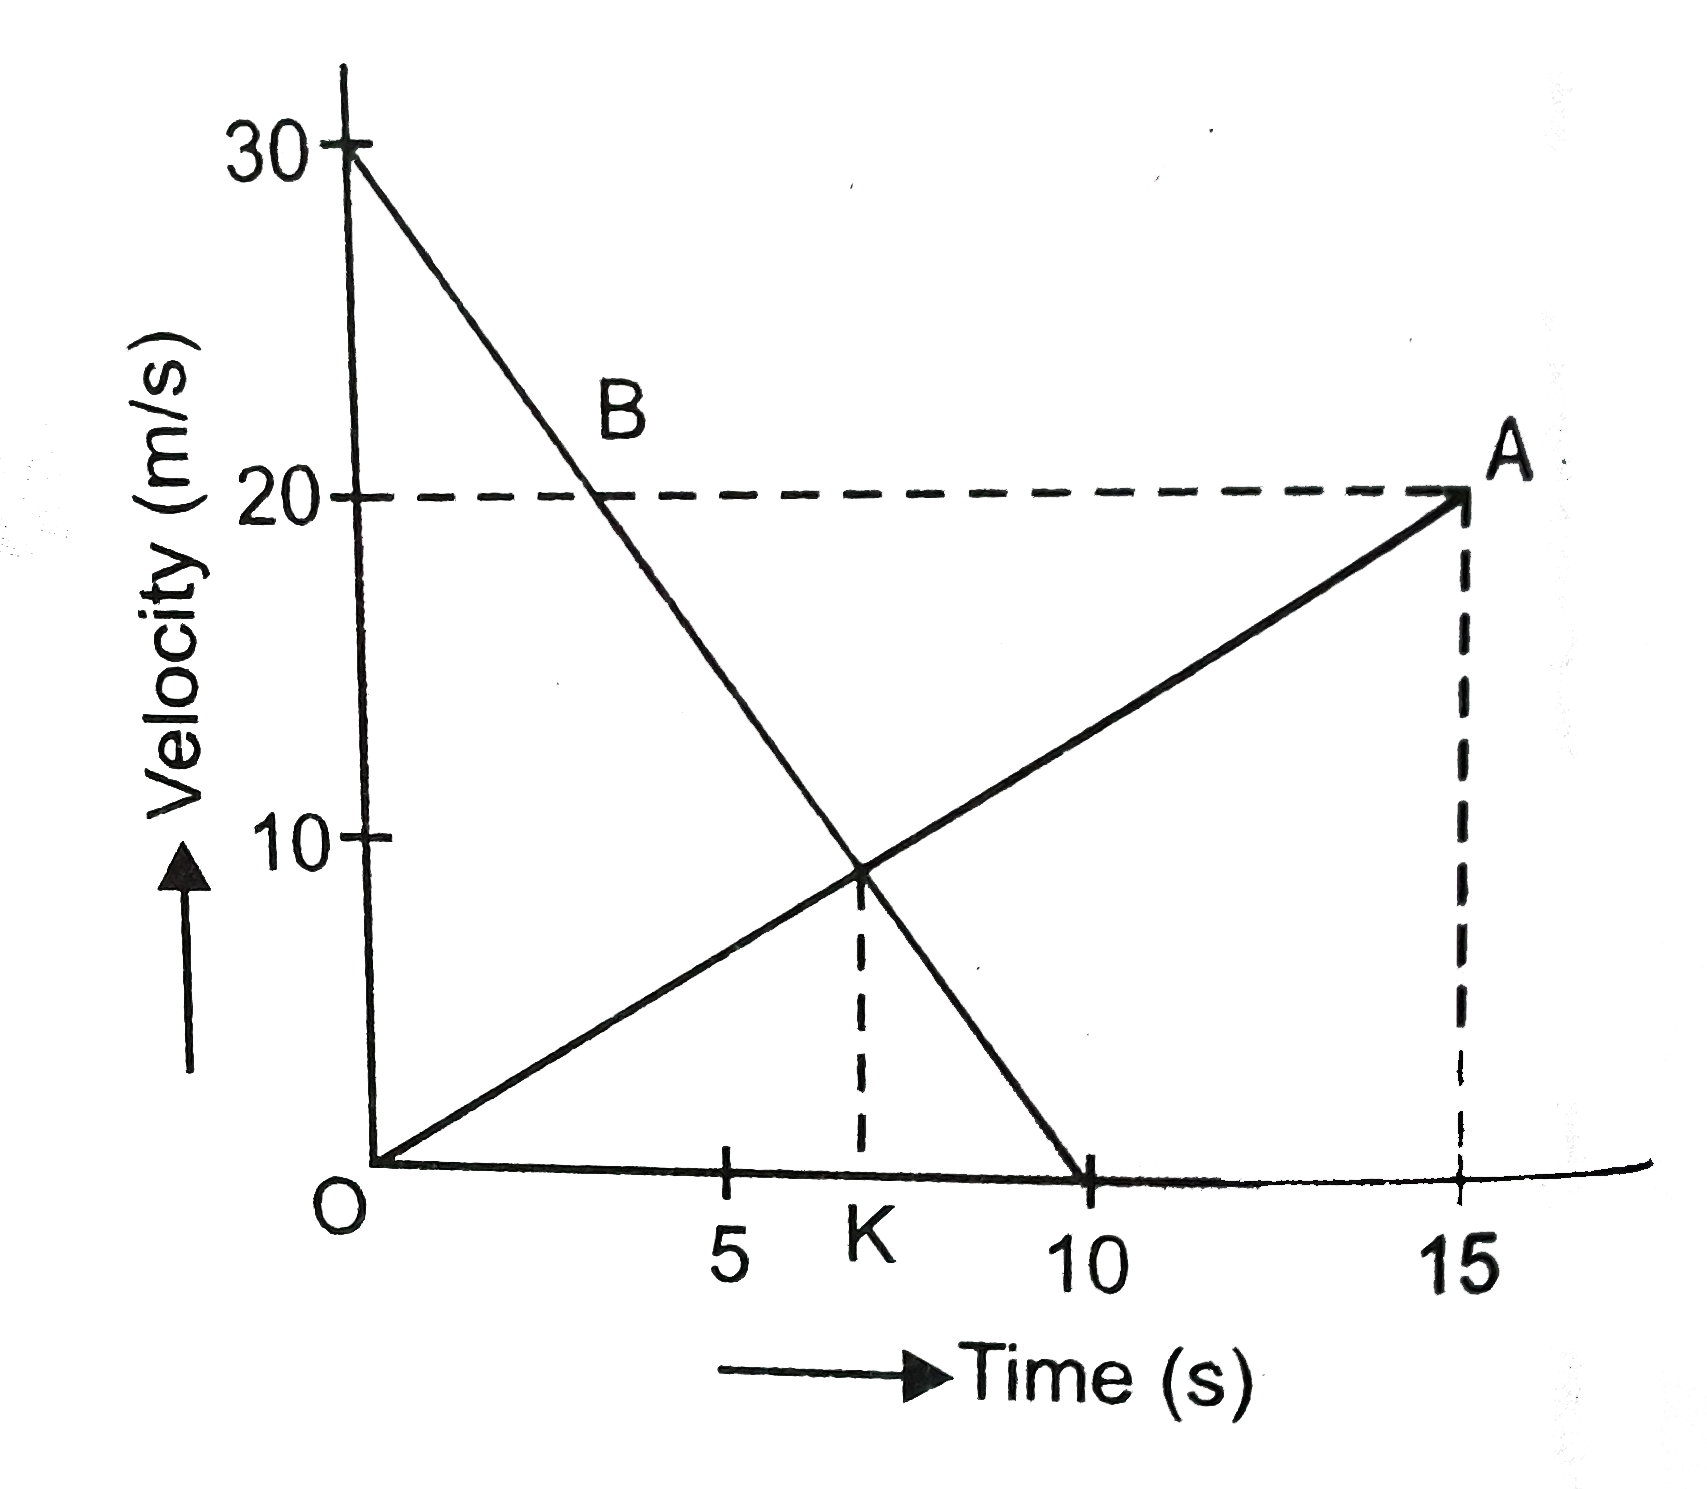
The velocity time graphs of two bodies A and B are shown in Figure. Observe these graphs carefully and answer the following questions :
(i) From the shape of graphs, what is nature of motion of A and B
(ii) What do you infer from the slopes of the graphs ?
(iii) What are the initial velocities of A and B ?
(iv) What is acceleration of A ?
(v) What is acceleration of B ?
(vi) What distance is travelled by B before coming to rest ?
(vii) At what time will the two bodies have equal velocity ?
 View Solution
This bar graph shows the temperatures in degree Celsius in different cities on a certain day in February. Observe the graph and answer the questions :
What is the difference between the maximum temperatures of Panchgani and Chandrapur ?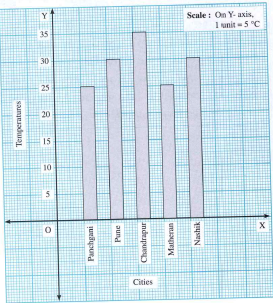 View Solution
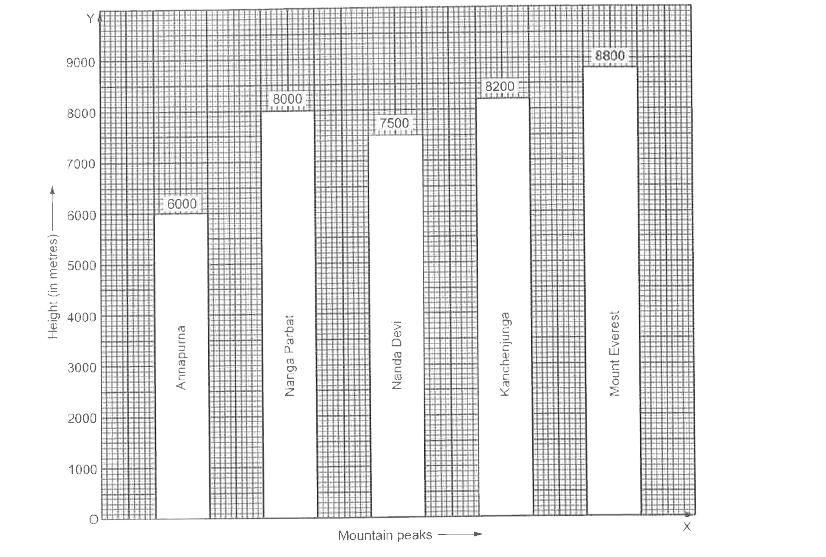
Given below is a bar graph showing the heights of five mountain peaks
Read the bar graph carefully and answer the following questions
Q(i) Which is the highest peak and what is its height (ii) What is the ratio of the heights of the highest peak and the next highest peak (iii) Arrange the heights of the given peaks in descending order
 View Solution
The line graph shows the temperature on four sundays of three cities
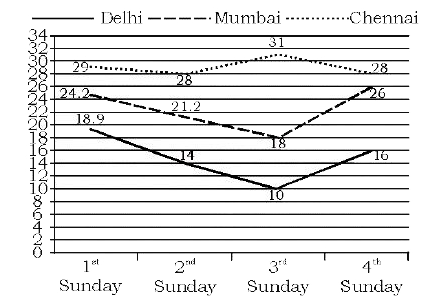
In the given line graph what was the difference in temperature between Delhi and Mumbai on the 2nd Sunday?View SolutionThe following distance-time graph is for a car travelling to certain places.
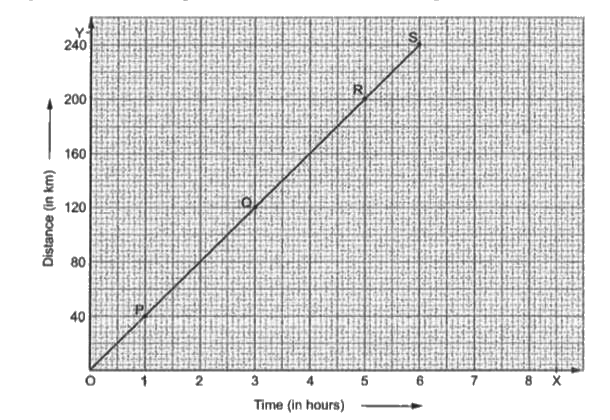
Study the above distance-time graph carefully and answer the questions given below :
(i) How far does the car travel in 412 hours ?
(ii) Hou much time does the car take to reach R ?
(iii) How long does the car take to cover 80km?
(iv) How far is Q from the starting point ?
(v) When does the car reach the place S after starting ?View Solution
