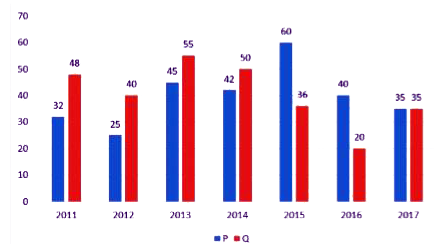
The Bar Graph shows the Profit (Rupees in Lakhs) earned by two companies P and Q during the period 2011 to 2017.
यह दंड आरेख दो कंपनियों P एवं Q के द्वारा 2011 से 2017 की अवधि में कमाए गए लाभ ( लाख रुपये में ) को
दर्शाता है |
 In which year the profit of two companies, taken together, is maximum:
किस वर्ष, इन दोनों कंपनियों का लाभ ( एक साथ ) अधिकतम है ?
2014
2015
2013
2017
The correct Answer is:C
Step by step video & image solution for The Bar Graph shows the Profit (Rupees in Lakhs) earned by two companies P and Q during the period 2011 to 2017. यह दंड आरेख दो कंपनियों P एवं Q के द्वारा 2011 से 2017 की अवधि में कमाए गए लाभ ( लाख रुपये में ) को दर्शाता है | In which year the profit of two companies, taken together, is maximum: किस वर्ष, इन दोनों कंपनियों का लाभ ( एक साथ ) अधिकतम है ? by Maths experts to help you in doubts & scoring excellent marks in Class 14 exams.
Updated on:21/07/2023Topper's Solved these Questions
Similar Questions
The graphs of the equations 3x+y-5=0 and 2x-y-5=0 intersect at the point P(α,β). What is the value of (3α+β) ?
समीकरण 3x+y-5=0 तथा 2x-y-5=0 के आरेख एक बिंदु P(α,β) पर एक-दूसरे को काटते है (3α+β) का मान क्या है ?
View SolutionAfter giving two successive discounts, each of x%, on the marked price of an article, total discount is Rs. 259.20. If the marked price of the article is Rs. 720, then the value of x is :
View SolutionMatch the following Column A to Column B

View SolutionThe inequation represented by the graph given below is :
View SolutionThe inequation that best describes the graph given below is _________
View SolutionThe inequation that best describes the following graph is _________
View SolutionThe given bar chart shows the details of cycle sales by a company between January and May for years 2017 and 2018.
दिया गया दंड आरेख वर्ष 2017 एवं 2018 में एक कंपनी के द्वारा जनवरी से लेकर मई तक साइकिल बिक्री की जानकारी देता है | In the given bar-chart, which month sales show the maximum decrease in 2018 as compared to 2017?
दिए गए दंड आरेख में, किस माह की बिक्री 2017 की तुलना में 2018 में अधिकतम कमी को दर्शाती है ?
View SolutionThe given bar chart shows the details of cycle sales by a company between January and May for years 2017 and 2018.
दिया गया दंड आरेख वर्ष 2017 एवं 2018 में एक कंपनी के द्वारा जनवरी से लेकर मई तक साइकिल बिक्री की जानकारी देता है | In the given bar-chart, which month sale shows the maximum increase in 2018 as against 2017?
/ दिए गए दंड आरेख के नुसार किस महीने की बिक्री 2017 की तुलना में 2018 में अधिकतम वृद्धि दर्शाती है ?
View SolutionThe given Bar graph presents the Demand and Production of motorcycles of five companies (in lakhs) दिया गया दंड आरेख पांच कंपनियों के संबंध में मोटरसाइकिलों की मांग और उत्पादन ( लाख में ) को दर्शाता है| What is the ratio of the total Demand of motorcycles of companies A and D taken together to the Production of motorcycles of company C? कंपनी A और D को मिलाकर मोटरसाइकिलों की कुल मांग का कंपनी C की मोटरसाइकिलों के उत्पादन के साथ अनुपात ज्ञात करें |
View SolutionThe given Bar Graph presents Income and Expenditure (in crores of Rupees) of a company for the five years, 2014 to 2018. दिया गया दंड आरेख पांच वर्षों अर्थात 2014 से 2018 तक एक कंपनी के आय एवं व्यय ( करोड़ रुपये में ) को दर्शाता है | In which year is the Expenditure more than 40% as compared to the Expenditure in the previous year? किस वर्ष में व्यय पिछले वर्ष के व्यय की तुलना में 40% अधिक है ?
View SolutionThe given Bar Graph presents Income and Expenditure (in crores of Rupees) of a company for the five years, 2014 to 2018. दिया गया दंड आरेख पांच वर्षों अर्थात 2014 से 2018 तक एक कंपनी के आय एवं व्यय ( करोड़ रुपये में ) को दर्शाता है | What is the ratio of total Expenditure to total Income of the company in 2014, 2016 and 2017? 2014, 2016 और 2017 में कंपनी के कुल व्यय और कुल आय में क्या अनुपात है ?
View SolutionThe given Bar Graph presents the number of students of two schools for six years. दिया गया दंड आरेख छः वर्ष की अवधि में दो विद्यालयों में छात्रों की संख्या को दर्शाता है | What is the average number of students from school B during the six year period (correct to two decimal places)? छः वर्षों की अवधि में विद्यालय B के छात्रों की औसत संख्या कितनी रही है? (दशमलव के दो स्थान तक )
View SolutionThe Bar Graph shows the Profit (Rupees in Lakhs) earned by two companies P and Q during the period 2011 to 2017.
यह दंड आरेख दो कंपनियों P एवं Q के द्वारा 2011 से 2017 की अवधि में कमाए गए लाभ ( लाख रुपये में ) को दर्शाता है |
In which year company P earns the maximum profit as compared to the previous year?
किस वर्ष कंपनी P को पिछले वर्ष की तुलना में अधिकतम लाभ हुआ है ?
View SolutionThe Bar Graph shows the Profit (Rupees in Lakhs) earned by two companies P and Q during the period 2011 to 2017.
यह दंड आरेख दो कंपनियों P एवं Q के द्वारा 2011 से 2017 की अवधि में कमाए गए लाभ ( लाख रुपये में ) को दर्शाता है | The ratio of profit during the given period for Company P to Company Q is:
दी गयी अवधि के दौरान कंपनी P और कंपनी Q के लाभ में क्या अनुपात है ?
View SolutionThe bar chart shows the annual food grain production (in million tonnes) for years 2012-2017. For how many years is the production less than the average production during the given period? यह दंड आरेख वर्ष 2012-2017 की अवधि में वार्षिक खाद्यान्न उत्पादन (मिलियन टन में ) को दर्शाता है | कितने वर्ष उत्पादन इस अवधि के औसत उत्पादन से कम है ?
View Solution
