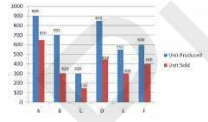
The given bar graph shows the production and sale of mobile handsets of five different companies A, B, C, D, E, & F during the period of one month.
दंड आरेख विभिन्न कंपनियों A, B, C, D, E & F की एक माह में मोबाइल हैंडसेट के उत्पादन और बिक्री को दर्शाता है |

The units sold by the companies A, B and C, taken together, is approximately what percent of the total units produced by the companies A, B and C ? (to the nearest integer )
कंपनी A, B और C द्वारा कुल मिलाकर बिक्री की गई यूनिटें, कंपनी A, B और C द्वारा मिलाकर उत्पादित कुल यूनिटों का लगभग कितना प्रतिशत है (निकटतम पूर्णाक तक)?
58
50
76
42
The correct Answer is:D
Step by step video & image solution for The given bar graph shows the production and sale of mobile handsets of five different companies A, B, C, D, E, & F during the period of one month. दंड आरेख विभिन्न कंपनियों A, B, C, D, E & F की एक माह में मोबाइल हैंडसेट के उत्पादन और बिक्री को दर्शाता है | The units sold by the companies A, B and C, taken together, is approximately what percent of the total units produced by the companies A, B and C ? (to the nearest integer ) कंपनी A, B और C द्वारा कुल मिलाकर बिक्री की गई यूनिटें, कंपनी A, B और C द्वारा मिलाकर उत्पादित कुल यूनिटों का लगभग कितना प्रतिशत है (निकटतम पूर्णाक तक)? by Maths experts to help you in doubts & scoring excellent marks in Class 14 exams.
Updated on:21/07/2023Topper's Solved these Questions
Similar Questions
The graphs of the equations 3x+y-5=0 and 2x-y-5=0 intersect at the point P(α,β). What is the value of (3α+β) ?
समीकरण 3x+y-5=0 तथा 2x-y-5=0 के आरेख एक बिंदु P(α,β) पर एक-दूसरे को काटते है (3α+β) का मान क्या है ?
View SolutionAfter giving two successive discounts, each of x%, on the marked price of an article, total discount is Rs. 259.20. If the marked price of the article is Rs. 720, then the value of x is :
View SolutionIn the given figure (not to scale), O is the centre of the circle. A,B,C and D are concyclic and AB=CD . If /_MON =120^(@) , then find /_ OPN .
View SolutionDetermine the point of symmetry of a regular hexagon.
View SolutionMatch the following Column A to Column B

View SolutionMatch the following Column A to Column B

View SolutionMatch the following Column A to Column B

View SolutionThe inequation represented by the graph given below is :
View SolutionThe inequation that best describes the graph given below is _________
View SolutionThe inequation that best describes the following graph is _________
View SolutionIn the given figure, PQRS is a parallelogram. A and B are the mid-point of ¯¯¯¯¯¯PQ and ¯¯¯¯¯SR respectively. If PS=BR, then the quadrilateral ADBC is a…………………… ,
ltimg src="https://d10lpgp6xz60nq.cloudfront.net/physics_images/PS_MATH_IX_C12_E05_020_Q01.png" width="80%"gt
View SolutionMatch the items given in column A and B: ltimg src="https://d10lpgp6xz60nq.cloudfront.net/physics_images/NCERT_BIO_XII_C16_E01_004_Q01.png" width="80%"gt
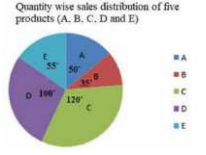
View SolutionThe given pie chart shows the quantity wise sales distribution of five products (A, B, C, D and E) of a company in 2016.
दिया गया पाई चार्ट 2016 में एक कंपनी के पाँच उत्पादों ( A, B, C, D और E ) की मात्रा वार बिक्री का वितरण दर्शाता है | If 320 units of product A were sold by the company, then how many units of products B and E together were sold by the company?
यदि कंपनी के द्वारा वस्तु A की 320 इकाइयाँ बेची गयीं , तो कंपनी के द्वारा बेची गयी वस्तु B और E की कुल इकाइयों की संख्या ज्ञात करें |
View SolutionThe given Bar graph presents the Demand and Production of motorcycles of five companies (in lakhs) दिया गया दंड आरेख पांच कंपनियों के संबंध में मोटरसाइकिलों की मांग और उत्पादन ( लाख में ) को दर्शाता है| The average Production of motorcycles of companies B, C and E taken together is what percent less than the Demand of motorcycles of D? कंपनी B, C और E को मिलाकर मोटरसाइकिलों का औसत उत्पादन D की मोटरसाइकिलों की मांग से कितना प्रतिशत कम है ?
View SolutionThe given Bar graph presents the Demand and Production of motorcycles of five companies (in lakhs) दिया गया दंड आरेख पांच कंपनियों के संबंध में मोटरसाइकिलों की मांग और उत्पादन ( लाख में ) को दर्शाता है| What is the ratio of the total Demand of motorcycles of companies A and D taken together to the Production of motorcycles of company C? कंपनी A और D को मिलाकर मोटरसाइकिलों की कुल मांग का कंपनी C की मोटरसाइकिलों के उत्पादन के साथ अनुपात ज्ञात करें |
View Solution