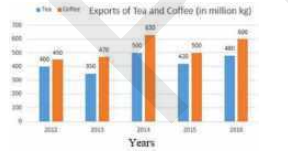
The given Bar Graph presents the Export of Tea and Coffee (in million kg) for the years 2012 to 2016.
दिया गया दंड आरेख वर्ष 2012 से 2016 के दौरान चाय और कॉफ़ी के निर्यात ( मिलियन किलो ग्राम में ) को दर्शाता है |
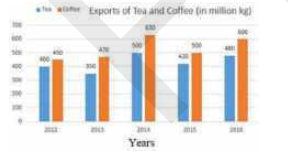
The number of years, in each of which the export of coffee is more than 20% as compared to the export of tea in that year is:
ऐसे कितने वर्ष हैं जिनमें से प्रत्येक में कॉफ़ी का निर्यात इस वर्ष में चाय के निर्यात की तुलना में 20% अधिक है ?
2
3
4
1
Step by step video & image solution for The given Bar Graph presents the Export of Tea and Coffee (in million kg) for the years 2012 to 2016. दिया गया दंड आरेख वर्ष 2012 से 2016 के दौरान चाय और कॉफ़ी के निर्यात ( मिलियन किलो ग्राम में ) को दर्शाता है | The number of years, in each of which the export of coffee is more than 20% as compared to the export of tea in that year is: ऐसे कितने वर्ष हैं जिनमें से प्रत्येक में कॉफ़ी का निर्यात इस वर्ष में चाय के निर्यात की तुलना में 20% अधिक है ? by Maths experts to help you in doubts & scoring excellent marks in Class 14 exams.
Updated on:21/07/2023Topper's Solved these Questions
Similar Questions
The given Bar Graph presents the Export of Tea and Coffee (in million kg) for the years 2012 to 2016. What is the ratio of total export of tea in 2012, 2014 and 2015 to the total export of coffee in 2013 and 2014?
दिया गया दंड आरेख वर्ष 2012 से 2016 के दौरान चाय और कॉफ़ी के निर्यात ( मिलियन किलो ग्राम में ) को दर्शाता है |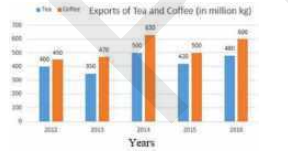
2012, 2014 और 2015 में चाय के कुल निर्यात का 2013 और 2014 में कॉफ़ी के कुल निर्यात के साथ अनुपात ज्ञात करें |
View SolutionThe given Bar Graph presents Income and Expenditure (in crores of Rupees) of a company for the five years, 2014 to 2018.
दिया गया दंड आरेख पांच वर्षों अर्थात 2014 से 2018 तक एक कंपनी के आय एवं व्यय ( करोड़ रुपये में ) को दर्शाता है |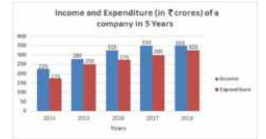 In which year is the Expenditure more than 40% as compared to the Expenditure in the previous year?
किस वर्ष में व्यय पिछले वर्ष के व्यय की तुलना में 40% अधिक है ?
View Solution
Knowledge Check
The given Bar Graph presents the Export of Tea and Coffee (in million kg) for the years 2012 to 2016.

The number of years, in each of which the export of coffee is more than 20% as compared to the export of tea in that year is:A1B3C4D2The given Bar graph presents the Export of Tea and Coffe ( in million kg ) for the years 2012 to 2016.
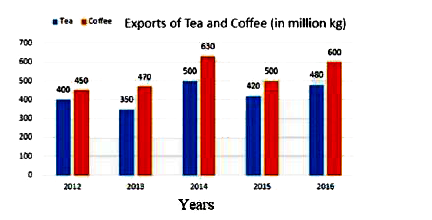
What is thr ratio of total export of tea in 2012 , 2014 and 2015 to the total export of coffee in 2013 and 2014 ?A6:5B10:9C9:10D5:6The given Bar Graph presents the Export of Tea and Coffee (in million kg) for the years 2012 to 2016.
 Total export of coffee is approximately what percent more than the total export of tea during
the five years? A23B28C26D25
The given Bar Graph presents Different Type of Vehicles (in lakhs) exported by a company in 2016 and 2017.
दिया गया दंड आरेख 2016 और 2017 में एक कंपनी के द्वारा निर्यात किये गए अलग-अलग प्रकार के वाहनों ( लाख में ) को दर्शाता है |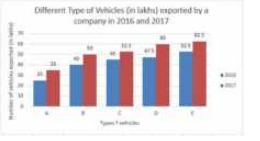 The export of which type of vehicle in 2017 is approximately 18.3% more than the export of
same type of vehicle in 2016?
2017 में किस प्रकार के वाहन का निर्यात 2016 में इसी वाहन के निर्यात से लगभग 18.3% अधिक है ?
View SolutionThe given Bar Graph presents Income and Expenditure (in crores of Rupees) of a company for the five years, 2014 to 2018.
दिया गया दंड आरेख पांच वर्षों अर्थात 2014 से 2018 तक एक कंपनी के आय एवं व्यय ( करोड़ रुपये में ) को दर्शाता है | In which year the percentage increase in the income as compared to that in its preceding
year is between 5% and 8%?
किस वर्ष आय में प्रतिशत वृद्धि पिछले वर्ष की तुलना में 5% से 8% के बीच है ?
View SolutionThe given Bar Graph presents the Export of Tea and Coffee (in million kg) for the years 2012 to 2016.

Total export of coffee is approximately what percent more than the total export of tea during the five years?
View SolutionThe given bar graph shows the imports and exports (in Rs crores) of steel by a country from 2013 to 2017.
दिया गया दंड आरेख एक देश के द्वारा 2013 से 2017 तक इस्पात के आयात और निर्यात ( करोड़ रुपये में) को दर्शाता है |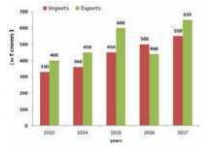 In how many years were the imports more than 80% of the average exports (per year) of the
country during the given 5 years?
दिए गए 5 वर्षों के दौरान कितने वर्ष देश के आयात देश के औसत निर्यात ( प्रति वर्ष ) के 80% से अधिक रहे हैं?
View SolutionThe given bar graph presents the number of different types of vehicles (in lakhs) exported by a company during 2014 and 2015.
दिया गया दंड आरेख एक कंपनी के द्वारा 2014 और 2015 में निर्यात किये गए अलग-अलग प्रकार के वाहनों की संख्या ( लाख में ) को दर्शाता है |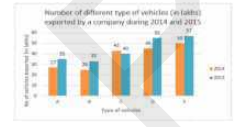 Which type of vehicle showed 32% increase in export in 2015 as compared to that in the previous year?
किस प्रकार के वाहन के निर्यात में पिछले वर्ष की तुलना में 2015 में 32% की वृद्धि देखने को मिली ?
View Solution
