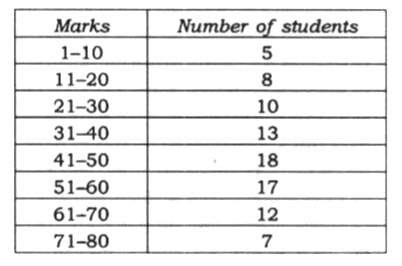
As per the data shown in the following table, what is the percentage of students who got less than 50 marks?
निम्नलिखित तालिका में दिए गए आंकड़ों के अनुसार, उन छात्रों का प्रतिशत क्या है जिन्हें 50 अंक से कम अंक आए हैं ?

0.60
0.48
0.72
0.38
Step by step video & image solution for As per the data shown in the following table, what is the percentage of students who got less than 50 marks? निम्नलिखित तालिका में दिए गए आंकड़ों के अनुसार, उन छात्रों का प्रतिशत क्या है जिन्हें 50 अंक से कम अंक आए हैं ? by Maths experts to help you in doubts & scoring excellent marks in Class 14 exams.
Updated on:21/07/2023Topper's Solved these Questions
Similar Questions
As per the data in the table, what is the percentage of students who got 20 or more marks?
दी गयी तालिका के आंकड़ों के अनुसार, 20 या अधिक अंक प्राप्त हे वाले छात्रों का प्रतिशत कितना है ?
View SolutionFrom the given table, what is the percentage of students scoring 40 or more, but less than 70.
दी गयी तालिका से, ऐसे छात्रों का प्रतिशत ज्ञात करें जिन्होंने 40 अथवा अधिक लेकिन 70 से कम अंक प्राप्त किया है |
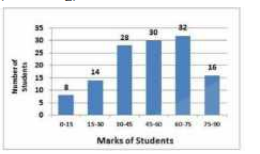
View SolutionIn the given histogram, what is the mean marks of the students, correct to one decimal place?
दिए गए आयतचित्र के अनुसार एक दशमलव स्थान तक छात्रों का माध्य अंक क्या है ?
View SolutionIn an examination, the average score of students in a class who passed is 69 and that of who failed is 61. If the average score of all the students, who appeared in the examination is 66, then the percentage of students who passed is:
एक परीक्षा में, किसी कक्षा में पास करने वाले छात्रों का औसत अंक 69 है तथा फेल करने वाले छात्रों का औसत अंक 61 है | यदि परीक्षा में शामिल होने वाले सभी छात्रों का औसत अंक 66 है, तो पास करने वाले छात्रों का प्रतिशत ज्ञात करें |
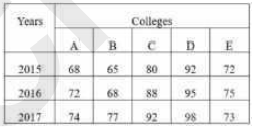
View SolutionThis table shows the percentage of students passing out of five different colleges over three years. It is given that from each college, 200 students appeared every year.
यह तालिका तीन वर्षों में पांच अलग-अलग कॉलेजों से पास करने वाले छात्रों का प्रतिशत दर्शाती है | यह दिया गया है कि प्रत्येक कॉलेज से हर वर्ष 200 छात्र शामिल हुए | In which college the average percentage of passing students over the given three years is the
least?
किस कॉलेज में दिए गए तीन वर्षों के दौरान पास करने वाले छात्रों का औसत प्रतिशत सबसे कम रहा है ?
View SolutionThe given histogram shows the height of the students:
दिए गए हिस्टोग्राम छात्रों की लम्बाई को दर्शाता है
The number of students whose height is in the class interval 165-170 is what percentage less than the number of students whose height is in the interval 150-155?
कक्षा अंतराल 165-170 में जिन छात्रों की लम्बाई है, उन छात्रों की संख्या प्रतिशत में कितना कम है लम्बाई अंतराल 150-155 से ज्ञात करे |
View SolutionThe following table shows the marks of 90 students in a test of 80 marks :

The percentage of students who have obtained less than or equal to 50% marks is
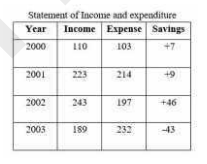
View SolutionThe table shows Income and expenditure of a person for 3 years (in thousands)
यह तालिका 3 वर्षों के दौरान किसी व्यक्ति के आय एवं व्यय (हज़ार में ) को दर्शाती है | In the given table, what is the percentage of expenditure on income in the year 2002? (round
off)
दी गयी तालिका के अनुसार, वर्ष 2002 में आय पर व्यय का प्रतिशत कया है?
View SolutionThe given bar chart shows the number of students in a class who have secured marks in three ranges: >75%, 60%-74% and <60%.
दिए गए दंड आरेख एक वर्ग में उन छात्रों की संख्या को दर्शाया गया है जिन्होंने तीन श्रेणियों में अंक प्राप्त किए हैं: ge75%, 60% -74% और <60% What is the total number of girls and boys?
लड़कियों और लड़कों की कुल संख्या क्या है?
View SolutionThe following table shows the number of students enrolled in different faculties in a college.
निम्नलिखित तालिका एक कॉलेज में अलग-अलग विषयों में नामांकित छात्रों की संख्या को दर्शाती है | The percentage of students studying in faculties other than Science is:
विज्ञान के अतिरिक्त अन्य विषयों की पढ़ाई करने वाले छात्रों का प्रतिशत है
View Solution
