Study the graph and answer the following questions.
आरेख का अध्ययन करें और निम्नलिखित प्रश्नों के उत्तर दें।
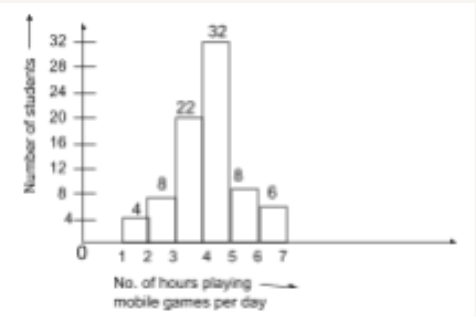 How many students spend 5 hours or more than 5 hours playing mobile games per day”?
कितने छात्र प्रति दिन मोबाइल गेम खेलने में 5 घंटे या 5 घंटे से अधिक समय बिताते हैं?
46
14
8
6
Step by step video & image solution for Study the graph and answer the following questions. आरेख का अध्ययन करें और निम्नलिखित प्रश्नों के उत्तर दें। How many students spend 5 hours or more than 5 hours playing mobile games per day”? कितने छात्र प्रति दिन मोबाइल गेम खेलने में 5 घंटे या 5 घंटे से अधिक समय बिताते हैं? by Maths experts to help you in doubts & scoring excellent marks in Class 14 exams.
Updated on:21/07/2023Topper's Solved these Questions
Similar Questions
Study the graph and answer the questions based on the graph:
आरेख का अध्ययन करें और आरेख के आधार पर प्रश्नों के उत्तर दें: On which day the production was 1/5 th of the total production?
किस दिन उत्पादन कुल उत्पादन का 1/5 था?
View SolutionStudy the graph and answer the questions based on the graph:
आरेख का अध्ययन करें और आरेख के आधार पर प्रश्नों के उत्तर दें: What was the percentage decline in the production from Friday to Saturday?
शुक्रवार से शनिवार तक उत्पादन में कितने प्रतिशत की गिरावट रही?
View Solution
Knowledge Check
Study the following bar diagram carefully and answer the following questions :
:
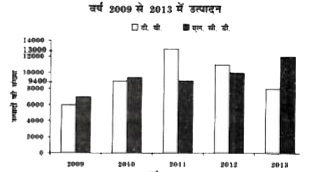
The total number of a products of electronic items is maximum in the year.A(a) 2010B(b) 2009C(c) 2011D(d) 2013Study the following bar diagram carefully and answer the following questions :
निम्नलिखित आरेख का ध्यानपूर्वक अध्ययन करें और दिए गए प्रश्नों का उत्तर दें:
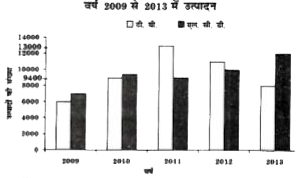
The ratio of production of TVs in the years 2009 and 2010 is.
वर्ष 2009 और 2010 में टी. वी. के उत्पादन का अनुपात -A(a)7:6B(b) 2:3C(c) 6:7D(d) 3:2
Study the following diagram and answer the given question.
निम्नलिखित आरेख का अध्ययन करें और दिए गए प्रश्न का उत्तर दें।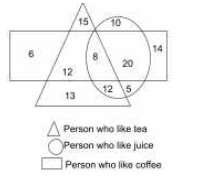 How many people like both tea and coffee, but do NOT like juice?
कितने लोग चाय और कॉफी दोनों पसंद करते हैं, लेकिन जूस पसंद नहीं करते?
View SolutionStudy the given chart and answer the following questions:
दिए गए चार्ट का अध्ययन करें और निम्नलिखित प्रश्नों के उत्तर दें: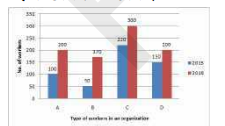 The percentage increase in the number of workers in 2018 is maximum as compared to that is
2015 in case of workers of type:
2018 में श्रमिकों की संख्या में प्रतिशत वृद्धि 2015 की तुलना में अधिकतम है, जो कि किस प्रकार के श्रमिकों के मामले में है?
View SolutionStudy the following graph and answer the questions based on the graph.
आरेख का अध्ययन करें और आरेख के आधार पर प्रश्नों के उत्तर दें: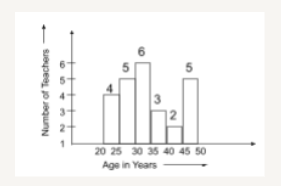 What percentage of the total number of teachers are aged less than 45 years?
कुल शिक्षकों में से कितने प्रतिशत 45 वर्ष से कम आयु के हैं?
View SolutionThe following table shows the number of students of 7 college participating in extra curricular activities:
निम्न सारणी उन कॉलेजों के छात्रों की संख्या दर्शाती है, जो पाठ्येत्तर क्रियाकलापों में भाग लेते हैं।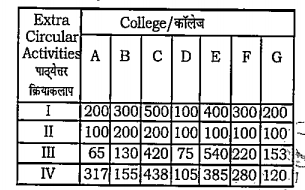 Read the table and answer the following question.
तालिका पढ़ें और निम्नलिखित प्रश्नों के उत्तर दें।
The difference of range of number of students in activity IV and the average of number of students in activity III per college is
क्रियाकलाप IV में छात्रों की संख्या के परिसर और क्रियाकलाप III में छात्रों की औसत संख्या प्रति कॉलेज का अंतर है-
View SolutionStudy the graph and answer the question that follows
आरेख का अध्ययन करें और प्रश्न का उत्तर दे।
In which year was the production of computers by the company 16% more than the average exports of computers in the six years (2013 to 2018)?
किस वर्ष कंपनी के द्वारा कंप्यूटरों का उत्पादन छः वर्षों (2013 से 2018) में कंप्यूटरों के औसत निर्यात से 16% अधिक था?
View SolutionStudy the graph and answer (the question that follows.
आरेख का अध्ययन करें और उस प्रश्न का उत्तर दें जो पूछा गया है What is the ratio of enrolment during 1995-1996 10 the enrolment during 1998-1999?
1998-1999 के दौरान नामांकन तथा ह 1995-1996 के दौरान नामांकन में : क्या अनुपात है?
View Solution
