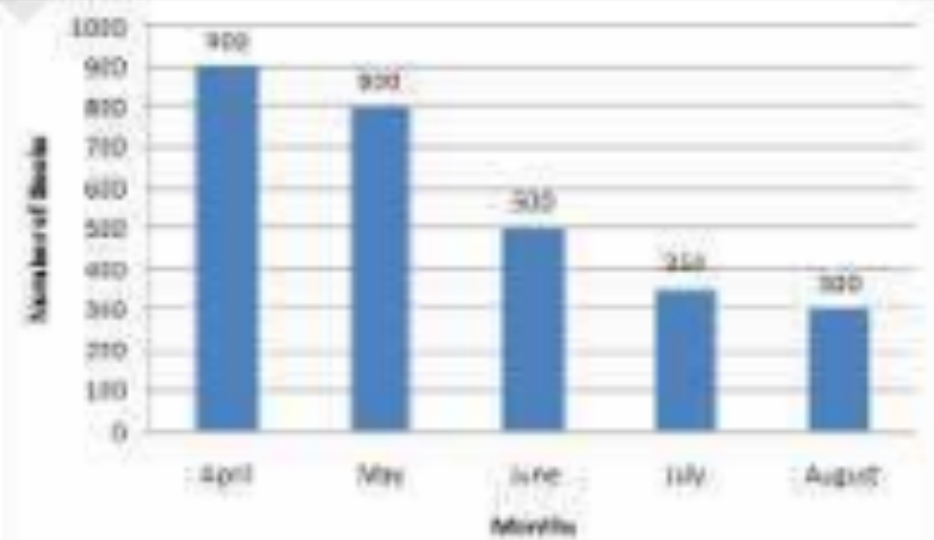
The following graph shows the number of books sold by a book-seller during five-months of 2019, April, May, June, July and August. Study the graph and answer the questions:
निम्नलिखित आरेख, 2019 के अप्रैल, मई, जून, जुलाई और अगस्त के पांच महीनों के दौरान एक पुस्तक-विक्रेता द्वारा बेची गई पुस्तकों की संख्या को दर्शाता है। आरेख का अध्ययन करें और प्रश्नों के उत्तर दें:
 The total number of books sold during these five month is:
इन पाँच महीनों के दौरान बेची गई
पुस्तकों की कुल संख्या है:
2950
2900
2850
2800
Step by step video & image solution for The following graph shows the number of books sold by a book-seller during five-months of 2019, April, May, June, July and August. Study the graph and answer the questions: निम्नलिखित आरेख, 2019 के अप्रैल, मई, जून, जुलाई और अगस्त के पांच महीनों के दौरान एक पुस्तक-विक्रेता द्वारा बेची गई पुस्तकों की संख्या को दर्शाता है। आरेख का अध्ययन करें और प्रश्नों के उत्तर दें: The total number of books sold during these five month is: इन पाँच महीनों के दौरान बेची गई पुस्तकों की कुल संख्या है: by Maths experts to help you in doubts & scoring excellent marks in Class 14 exams.
Updated on:21/07/2023Topper's Solved these Questions
Similar Questions
The following graph shows the number of boys and girls in class V, class VI, class VII and class VIII. Study the graph and answer the question.
निम्नलिखित आरेख कक्षा V, कक्षा VI, कक्षा VII और कक्षा VIII में लड़कों और लड़कियों की संख्या दर्शाता है। आरेख का अध्ययन करें और प्रश्न का उत्तर दें। What is the average number of girls in all the classes?
सभी कक्षाओं में लड़कियों की औसत संख्या क्या है?
View SolutionThe following graph shows the number of boys and girls in class V, class VI, class VII and class VIII. Study the graph and answer the question.
निम्नलिखित आरेख कक्षा V, कक्षा VI, कक्षा VII और कक्षा VIII में लड़कों और लड़कियों की संख्या दर्शाता है। आरेख का अध्ययन करें और प्रश्न का उत्तर दें। Which class has the maximum number of students?
किस कक्षा में छात्रों की अधिकतम संख्या है?
View SolutionThe following bar graph shows the number of deaths from road accident occurred during the rainy season in the year 1992. Study the graph carefully and answer the question that follows.
निम्नलिखित दंड आरेख वर्ष 1992 में बारिश के मौसम में हुई सड़क दुर्घटना से होने वाली मौतों की संख्या को दर्शाता है। आरेख का ध्यानपूर्वक अध्ययन करें और प्रश्न का उत्तर दें।
Between which two consecutive weeks was the fall in the number of deaths the greatest?
लगातार किन दो सप्ताहों के बीच मौत की संख्या में गिरावट सबसे बड़ी थी?
View SolutionThe following graph shows the number of boys and girls in class V, class VI, class VII and class VIII. Study the graph and answer the question.
निम्नलिखित आरेख कक्षा V, कक्षा VI, कक्षा VII और कक्षा VIII में लड़कों और लड़कियों की संख्या दर्शाता है। आरेख का अध्ययन करें और प्रश्न का उत्तर दें। In which class, the percentage increase in the number of boys as compared to its previous class is least?
किस कक्षा में लड़कों की संख्या में पिछले कक्षा की तुलना में प्रतिशत की वृद्धि सबसे कम है?
View SolutionThe following graph shows the number of boys and girls in class V, class VI, class VII and class VIII. Study the graph and answer the question.
निम्नलिखित आरेख कक्षा V, कक्षा VI, कक्षा VII और कक्षा VIII में लड़कों और लड़कियों की संख्या दर्शाता है। आरेख का अध्ययन करें और प्रश्न का उत्तर दें। What is the overall percentage increase in boys when compared to girls? (Correct to two decimal
places)
लड़कियों की तुलना में लड़कों में कुल प्रतिशत वृद्धि कितनी है? (दो दशमलव स्थानों के लिए)
View SolutionThe following graph shows the sales of cars (in thousands) in four cities in 4 years. Study the graph and answer the questions.
निम्नलिखित आरेख 4 वर्षों में चार शहरों में कारों की बिक्री (हज़ार में) को दर्शाता है। इस आरेख का अध्ययन कीजिए तथा प्रश्नों के उत्तर दीजिए। In 2019, what is the average number of sales among all the four cities?
2019 में, सभी चार शहरों में औसत बिक्री कितनी रही है?
View SolutionThe following graph shows the sales of cars (in thousands) in four cities in 4 years. Study the graph and answer the questions.
निम्नलिखित आरेख 4 वर्षों में चार शहरों में कारों की बिक्री (हज़ार में) को दर्शाता है। इस आरेख का अध्ययन कीजिए तथा प्रश्नों के उत्तर दीजिए। Which city has the highest percentage of sales, and in which year?
किस शहर की बिक्री का प्रतिशत सबसे अधिक है तथा किस वर्ष में?
View SolutionThe following graph shows the sales of cars (in thousands) in four cities in 4 years. Study the graph and answer the questions.
निम्नलिखित आरेख 4 वर्षों में चार शहरों में कारों की बिक्री (हज़ार में) को दर्शाता है। इस आरेख का अध्ययन कीजिए तथा प्रश्नों के उत्तर दीजिए। Which city has the highest sales?
किस शहर की बिक्री सबसे अधिक है?
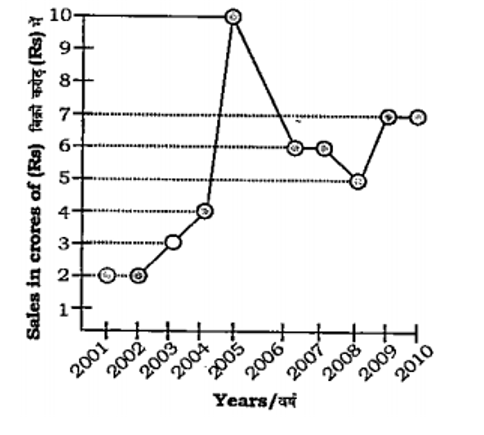
View SolutionThe following line diagram represents the yearly sales figure of a company in the years 2001-2010. Examine the diagram and answer the question.
निम्नलिखित रेखा आरेख किसी कंपनी की वर्ष 2007-2010 के दौरान वार्षिक बिक्री के आंकड़ों को दर्शाता है। आरेख का अध्ययन करें और नीचे दिए गए प्रश्नों के उत्तर दें- Average sale (in crore of Rs.) of the company during the period 2003-2007 is
वर्ष 2003 - 2007 की अवधि के दौरान कंपनी की औसत बिक्री (₹ करोड में) है-
View SolutionThe following line diagram represents the yearly sales figure of a company in the years 2001-2010. Examine the diagram and answer the question.
निम्नलिखित रेखा आरेख किसी कंपनी की वर्ष 2007-2010 के दौरान वार्षिक बिक्री के आंकड़ों को दर्शाता है। आरेख का अध्ययन करें और नीचे दिए गए प्रश्नों के उत्तर दें- The percentage increase in sales in the year 2005 with respect to the previous year is
वर्ष 2005 में पिछले वर्ष की तुलना में बिक्री में वृद्धि का प्रतिशत है-
View Solution
