The given bar chart shows the number of students in a class who have secured marks in three ranges: ≥75%,60%−74%and<60%.
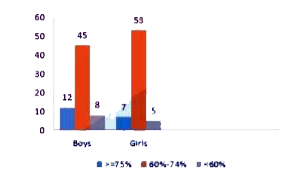
From the given information, identify the per cent of boys who got distinction.
0.1846
0.1678
0.1398
0.1529
Step by step video & image solution for The given bar chart shows the number of students in a class who have secured marks in three ranges: gt=75%, 60%-74% and lt60%. From the given information, identify the per cent of boys who got distinction. by Maths experts to help you in doubts & scoring excellent marks in Class 14 exams.
Updated on:21/07/2023Topper's Solved these Questions
Similar Questions
The given bar chart shows the number of students in a class who have secured marks in three ranges: >75%, 60%-74% and <60%.
दिए गए दंड आरेख एक वर्ग में उन छात्रों की संख्या को दर्शाया गया है जिन्होंने तीन श्रेणियों में अंक प्राप्त किए हैं: ge75%, 60% -74% और <60% What is the total number of girls and boys?
लड़कियों और लड़कों की कुल संख्या क्या है?
View SolutionThe given bar chart shows number of marks scored by a student in each subject in three years
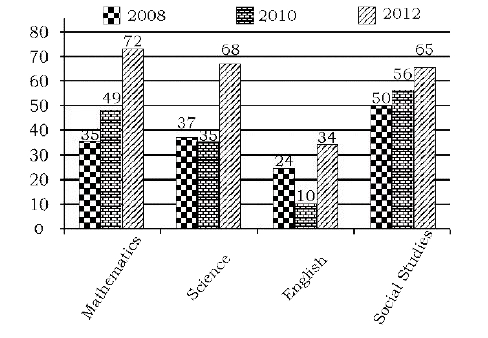
In the given bar chart what is the approximate percentage increase in marks in mathematics in 2012 compared to 2008?
View Solution
Knowledge Check
The given bar chart shows the number of students in a class who have secured marks in three ranges: >=75%,60%−74%and<60%.

What is the ratio of percentages of boys and girls who got marks from 60% to 74%?A69.23:81.53B64.12:88.23C62.78:82.67D67.54:87.45The given chart shows the number of students in Class 4, Class 5, Class 6 and Class 7 who got first class, second class and failed in the final examinations.
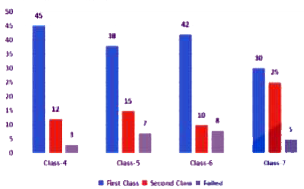
What is the pass percentage of Class 6?A0.8666B0.9012C0.8783D0.8996The given chart shows the number of students in Class 4, Class 5, Class 6 and Class 7 who got first class, second class andfailed in the final examinations. What is the pass percentage of Class 4?
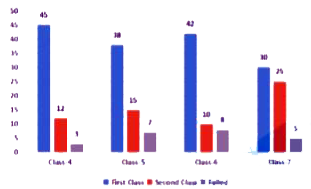
A94.66B91.23C98.28D95.87
The given bar chart shows number of marks scored by a student in each subject in three years:
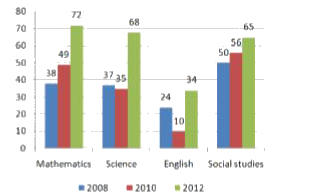
In the given bar-chart. what is the percentage increase in marks in Mathematics in 2012 compared to 2008?(round off)
View SolutionIn a class, the average marks of boys is 520 and that of the girls is 420. If the average marks per student is 500, the percentage of boys in the class is …….
View SolutionThe table given below shows the number of students who were absent and percentage of students who were present in the given two examinations from five different schools. The table also shows the percentage of students who were present in the Biology and Physics examination respectively.

The number of students who were present in Physics examination from school M is what per cent of number of students who were absent from schools M, L and O?
View SolutionThe given bar chart shows number of marks scored by a student in each subject in three years
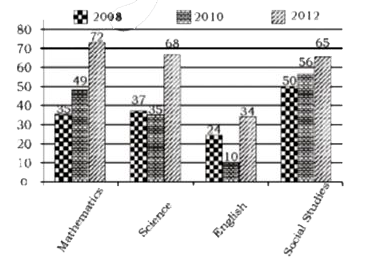
In the given bar chart if number of marks in social studies in year 2012 is 13% of the school strength the number of students is
View SolutionAs per data in the table, what is the percentage of students who got 20 or more marks

View Solution
