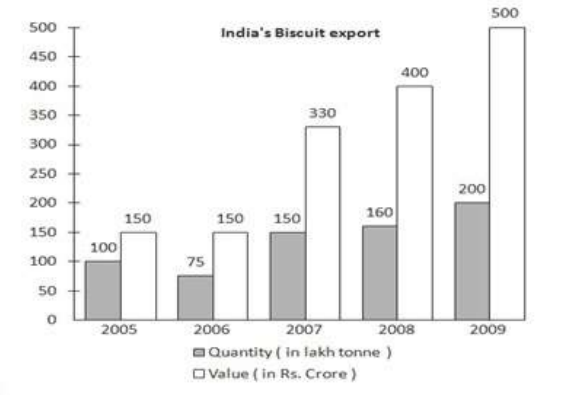
The given bar graph shows the biscuit exports of India over a period of five years. Study the graph and answer the question that follows.
दिया गया दंड आरेख में पांच साल की अवधि में भारत के बिस्किट निर्यात को दर्शाता है। आरेख का अध्ययन करें और उस प्रश्न का उत्तर दें जो पूछा गया है।
 In which year, the percentage increase in exports was maximum from its preceding year:
किस वर्ष में निर्यात में प्रतिशत वृद्धि इसके पूर्व वर्ष से अधिकतम थी?
2009
2006
2008
2007
The correct Answer is:D
Step by step video & image solution for The given bar graph shows the biscuit exports of India over a period of five years. Study the graph and answer the question that follows. दिया गया दंड आरेख में पांच साल की अवधि में भारत के बिस्किट निर्यात को दर्शाता है। आरेख का अध्ययन करें और उस प्रश्न का उत्तर दें जो पूछा गया है। In which year, the percentage increase in exports was maximum from its preceding year: किस वर्ष में निर्यात में प्रतिशत वृद्धि इसके पूर्व वर्ष से अधिकतम थी? by Maths experts to help you in doubts & scoring excellent marks in Class 14 exams.
Updated on:21/07/2023Topper's Solved these Questions
Similar Questions
The given bar graph shows the biscuit exports of India over a period of five years. Study the graph and answer the question that follows.
दिया गया दंड आरेख में पांच साल की अवधि में भारत के बिस्किट निर्यात को दर्शाता है। आरेख का अध्ययन करें और उस प्रश्न का उत्तर दें जो पूछा गया है। What was the percentage drop in the export quantity from 2005 to 2006?
2005 से 2006 तक निर्यात की मात्रा में कितने प्रतिशत की गिरावट थी?
View SolutionThe given graph represents the rainfall (in cm) in a city, over a period of six years. Study the graph and answer the question that follows.
दिया गया आरेख एक शहर में छह साल में हुई वर्षा (सेमी में) को प्रदर्शित करता है। आरेख का अध्ययन करें और उस प्रश्न का उत्तर दें, जो पूछा गया है। In which two consecutive years was the difference of the rainfall minimum?
कौन से लगातार दो वर्षों में वर्षा का अंतर न्यूनतम था?
View Solution
Knowledge Check
The given bar graph shows the biscuit exports of India over a period of five years. Study the graph and answer the questions that follows

In which two year was the value per tonne equal?A2006 and 2007B2008 and 2009C2007 and 2008D2005 and 2006
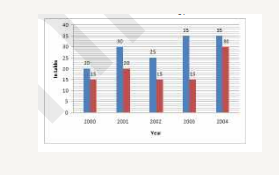
In the given bar graph, the Blue bar shows the income and the Red bar shows the expenditure of a company. Study the graph and answer the question that follows
दिए गए दंड आरेख में, नीला दंड एक कंपनी की आय दिखाता है और लाल दंड खर्च (लाख रुपये में) को दर्शाता है। आरेख का अध्ययन करें और उस प्रश्न का उत्तर दें जो नीचे पूछा गया है। The income in 2001 was equal to the expenditure in the year:
2001 में आय किस वर्ष के व्यय के बराबर है :
View SolutionIn the given bar graph, the Blue bar shows the income and the Red bar shows the expenditure of a company. Study the graph and answer the question that follows
दिए गए दंड आरेख में, नीला दंड एक कंपनी की आय दिखाता है और लाल दंड खर्च (लाख रुपये में) को दर्शाता है। आरेख का अध्ययन करें और उस प्रश्न का उत्तर दें जो नीचे पूछा गया है। The percentage decrease in the income of the company in 2002 as compared to that in 2001 is:
2001 की तुलना में 2002 में कंपनी की आय में कितने प्रतिशत में कमी आई है:
View SolutionIn the given bar graph, the Blue bar shows the income and the Red bar shows the expenditure of a company. Study the graph and answer the question that follows
दिए गए दंड आरेख में, नीला दंड एक कंपनी की आय दिखाता है और लाल दंड खर्च (लाख रुपये में) को दर्शाता है। आरेख का अध्ययन करें और उस प्रश्न का उत्तर दें जो नीचे पूछा गया है। The expenditure from 2001 to 2002 decreased by:
2001 से 2002 तक व्यय में कितनी कमी आई है?
View SolutionThe following graph shows the sales of cars (in thousands) in four cities in 4 years. Study the graph and answer the questions.
निम्नलिखित आरेख 4 वर्षों में चार शहरों में कारों की बिक्री (हज़ार में) को दर्शाता है। इस आरेख का अध्ययन कीजिए तथा प्रश्नों के उत्तर दीजिए। In which year, the sales are highest?
किस वर्ष, बिक्री सबसे अधिक हुई है?
View SolutionThe following graph shows the number of boys and girls in class V, class VI, class VII and class VIII. Study the graph and answer the question.
निम्नलिखित आरेख कक्षा V, कक्षा VI, कक्षा VII और कक्षा VIII में लड़कों और लड़कियों की संख्या दर्शाता है। आरेख का अध्ययन करें और प्रश्न का उत्तर दें। In which class, the percentage increase in the number of boys as compared to its previous class is least?
किस कक्षा में लड़कों की संख्या में पिछले कक्षा की तुलना में प्रतिशत की वृद्धि सबसे कम है?
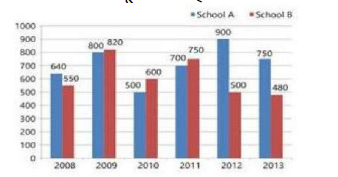
View SolutionThe given Bar Graph presents the number of students of two schools for six years.
दिया गया दंड आरेख छः वर्ष की अवधि में दो विद्यालयों में छात्रों की संख्या को दर्शाता है | In which year, the percentage increase in students in school B is the highest in comparison to its
previous year?
किस वर्ष में, विद्यालय B में छात्रों की संख्या में प्रतिशत वृद्धि इसके पिछले वर्ष की तुलना में सबसे अधिक रही है?
View SolutionThe following graph shows the sales of cars (in thousands) in four cities in 4 years. Study the graph and answer the questions.
निम्नलिखित आरेख 4 वर्षों में चार शहरों में कारों की बिक्री (हज़ार में) को दर्शाता है। इस आरेख का अध्ययन कीजिए तथा प्रश्नों के उत्तर दीजिए। Which city has the highest sales?
किस शहर की बिक्री सबसे अधिक है?
View Solution