The following charts shows the sales (in thousands) of pens , pencils and books in month1 , month2 and month3 . Answer the question based on the chart .
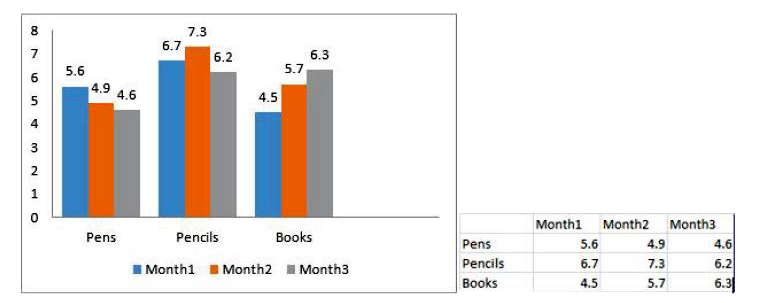
What is the average number of pens sold in the 3 months ?
3987
5432
5033
4935
Step by step video & image solution for The following charts shows the sales (in thousands) of pens , pencils and books in month1 , month2 and month3 . Answer the question based on the chart . What is the average number of pens sold in the 3 months ? by Maths experts to help you in doubts & scoring excellent marks in Class 14 exams.
Updated on:21/07/2023Topper's Solved these Questions
Similar Questions
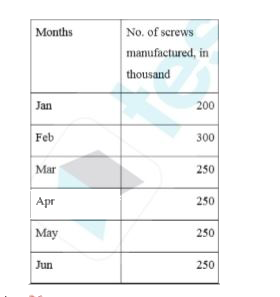
Based on the following tabel, what is the average number of screws manufactured in the unit over the given 6 months ?
View SolutionDirection: The given bar graph shows the number of pens sold by two shops A & B in four consecutive months. Study the following data and answer the following questions:
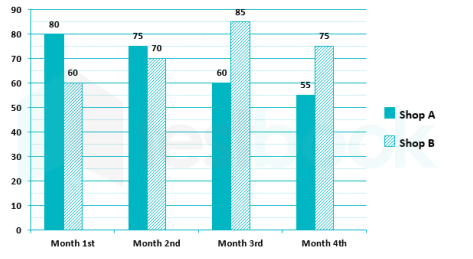
Find that the number of pens sold by shop A in 1st month is how much percent more than the number of pens sold by shop A in 3rd month.
View Solution
Knowledge Check
The following chart shows the sales (in thousands) of pens , pencils and books in months1, months2 and months3. Answer the question based on the chart .
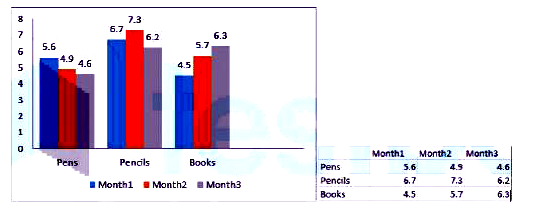
Which month has the highest sales ?AMonth1 and Month 3BMonth 1CMonth 3DMonth 2The following chart shows the sales ( in thousands ) of pens , pencils and books in month 1, month2 and months 3 . Answer the question based on the chart .
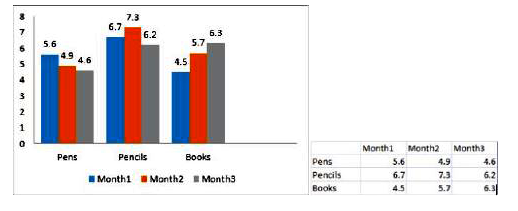
Which product has the highest percentage of sales, and in which month (among all months) ?APens, Month 1BPencils , Month 2CPencils , Months 3DBooks , Months 3The following chart shows the sales (in thousands) of pencils and books in month1, month2, and month3, Answer the question based on the chart .
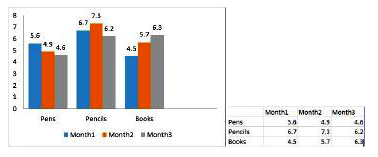
Which product has the highest sales in all 3 months ?APens and BooksBBooksCPensDPencils
Direction: The given bar graph shows the number of pens sold by two shops A & B in four consecutive months. Study the following data and answer the following questions:
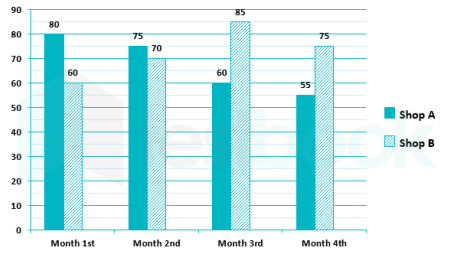
Find the ratio of the number of pens sold by shop A in 1st month to the number of pens sold by B in 3rd month.
View SolutionDirection: The given bar graph shows the number of pens sold by two shops A & B in four consecutive months. Study the following data and answer the following questions:
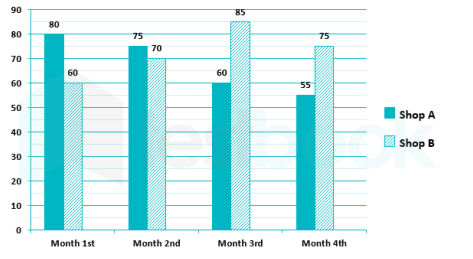
Find the average of the number of pens sold by shop A in 1st and 3rd months and the number of pens sold by shop B in 3rd and 4th month together.
View SolutionThe pie-chart given here shows expenditures incurred by a family on various items and their savings, which amounts to Rs 8,000 in a month.
Study the chart and answer the questions based on the pie-chart
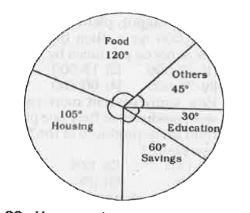
What is the total expenditure of the family for the month ?
View SolutionDirections : The pie-chart given below shows expenditure incurred by a family on various items and their savings. Study the chart and answer the questions based on the pie-chart
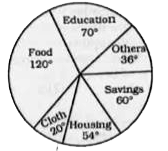
The ratio of expenditure on food to saving is :
View SolutionThe given bar graph present the sale of a particular brand of tea by three outlets A,B and C during the months Jan, feb , mar and Apr 2018.
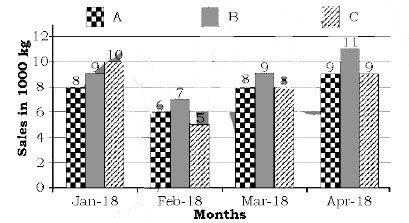
What is the average sale per month by A during jan-mar 2018?
View Solution
