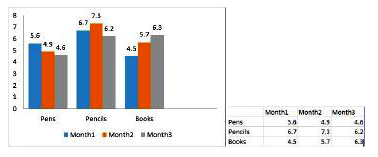
The following chart shows the sales ( in thousands ) of pens , pencils and books in month 1, month2 and months 3 . Answer the question based on the chart .
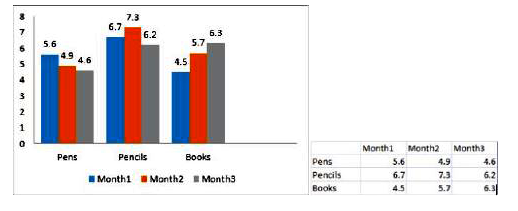
Which product has the highest percentage of sales, and in which month (among all months) ?
Pencils, Month 3/ पेन्सिल, माह 3
Pens, Month 1/ पेन , माह 1
Pencils, Month 2/ पेंसिल , माह 2
Books, Month 3/ किताबें , माह 3
Step by step video & image solution for The following chart shows the sales ( in thousands ) of pens , pencils and books in month 1, month2 and months 3 . Answer the question based on the chart . Which product has the highest percentage of sales, and in which month (among all months) ? by Maths experts to help you in doubts & scoring excellent marks in Class 14 exams.
Updated on:21/07/2023Topper's Solved these Questions
Similar Questions
The following Bar chart shows the sales of a company XYZ (in Rs Crore). Study the chart and answer the following questions.
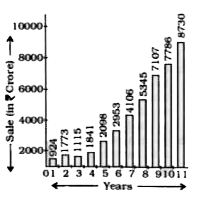
The 2nd highest sale in the year :
View SolutionThe given bar graph shows the sale of different brands of shirts in a shop in one month.
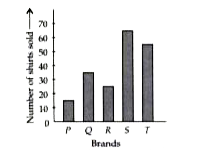
(i) How many total shirts are sold in the month ?
View Solution
Knowledge Check
The following chart shows the sales (in thousands) of pens , pencils and books in months1, months2 and months3. Answer the question based on the chart .
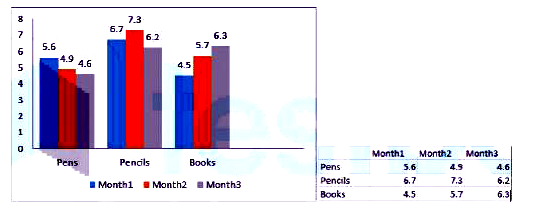
Which month has the highest sales ?AMonth1 and Month 3BMonth 1CMonth 3DMonth 2The following chart shows the sales (in thousands) of pencils and books in month1, month2, and month3, Answer the question based on the chart .
Which product has the highest sales in all 3 months ?APens and BooksBBooksCPensDPencilsThe following charts shows the sales (in thousands) of pens , pencils and books in month1 , month2 and month3 . Answer the question based on the chart .
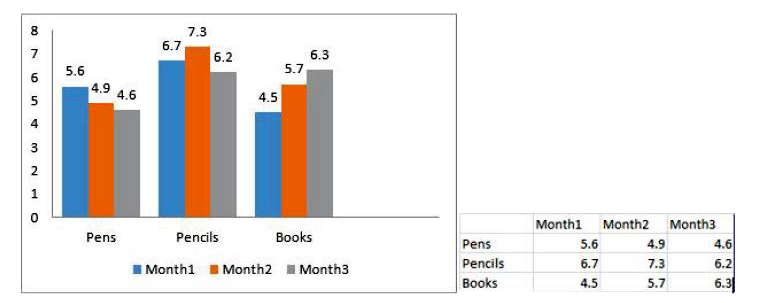
What is the average number of pens sold in the 3 months ?A3987B4935C5033D5432
The following Bar chart shows the sales of a company XYZ (in Rs Crore). Study the chart and answer the following questions.
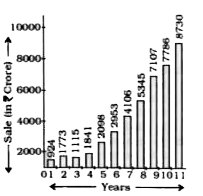
The mean of the highest and the lowest sale (in Rs Crore) is :
View SolutionThe following table shows the birth months of 48 babies in a hospital:

Find the probability of months in which 6 babies were born
View SolutionStudy the following graph carefully and answer the question given below it.
Production and sale of printers of various companies in a month.
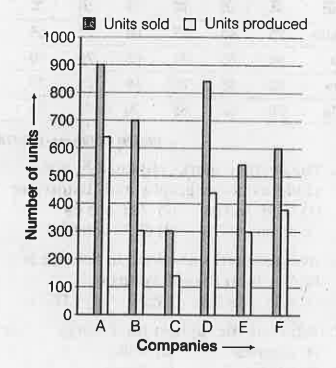
Which company had the highest percentage of sale with respect to its production ?
View SolutionThe pie-chart given here shows expenditures incurred by a family on various items and their savings, which amounts to Rs 8,000 in a month.
Study the chart and answer the questions based on the pie-chart
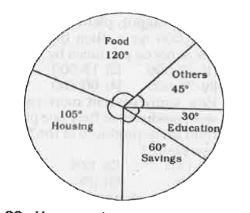
What is the total expenditure of the family for the month ?
View SolutionIn the following questions, study the two pie-charts and answer the questions.
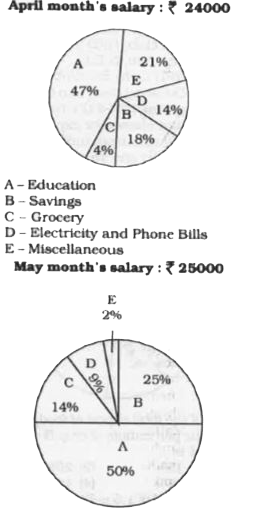
What is the percent increase in Education in May month than April month ?
View Solution
