Study the given graph and asnwer the question that follows.
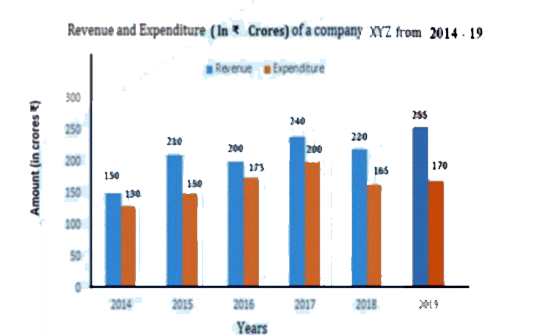
In how many years was the profit (Revennue - Expenditure) as a percentage of the revenue more than 25% ?
2
1
3
4
Step by step video & image solution for Study the given graph and asnwer the question that follows. In how many years was the profit (Revennue - Expenditure) as a percentage of the revenue more than 25% ? by Maths experts to help you in doubts & scoring excellent marks in Class 14 exams.
Updated on:21/07/2023Topper's Solved these Questions
Similar Questions
Study the given graph and answer the question that follows
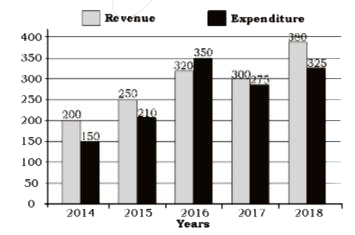
In how many years was the revenue of the company more than 1.2 times the average expenditure over the given five years?
View SolutionStudy the given graph and answer the question that follows
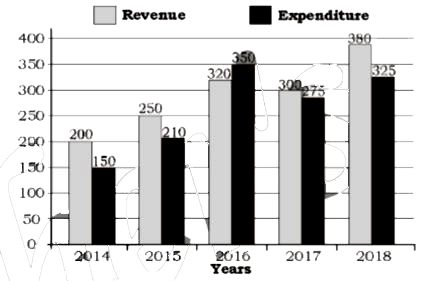
Total expenditure of the company in 2016, 2017 and 2018 is what percentage less than the total revenue in the given five years
View Solution
Knowledge Check
Study the following graph carefully and answer the questions that
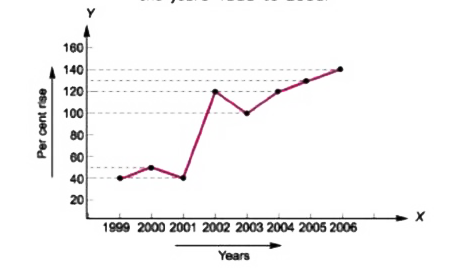
For how many years , the percent rise was more than 100 % ?AOneBTwoCThreeDNone of theseStudy the given graph and answer the question that follows.
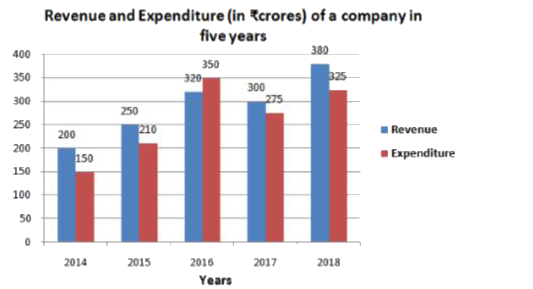
Total expenditure of the company in 2016, 2017 and 2018 is what percentage less than the total revenue in the given five years (correct to one decimal place)?A0.384B0.345C0.362D0.368Study the following graph carefully and answer the questions that follow
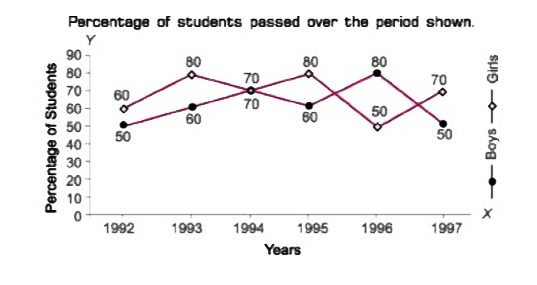
For how many years was there a paired rise or fall in the percentage of boys and girls passed over the period shown ?ANilB1C2D3
Study the following graph and answer the given questions:
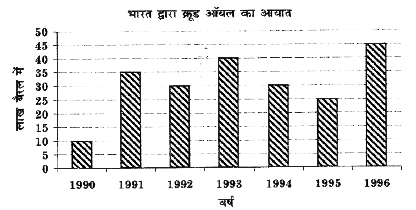
In how many years were the imports higher than the average value of imports?
View SolutionStudy the following graph carefully and answer the questions that follow
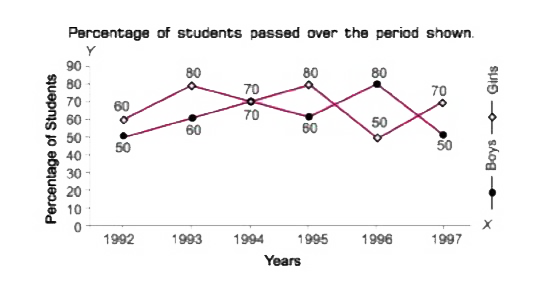
For how many times was the gap constant for the percentage of successful boys and girls ?
View SolutionStudy the given graph and answer the question that follows.
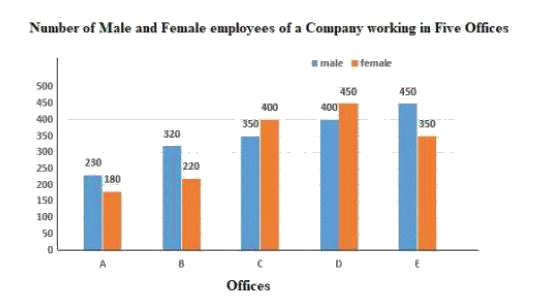
In which office of the company is the number of male employees 25% more than the average number of female employees in all five offices?
View SolutionStudy the following graph carefully and answer the questions that
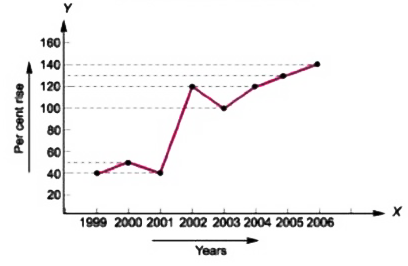
For how many years , the percent rise was lower than the average of the percent rise over the given years ?
View SolutionStudy the following graph and answer questions
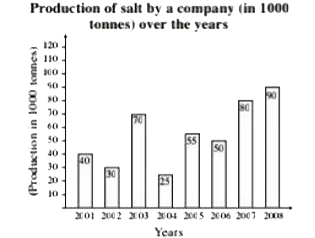
In how many of the given years was the production of salt more than the average production of the given years?
View Solution