Study the following bar graph and answer the questions given below.
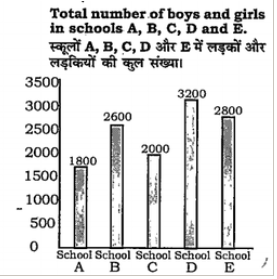
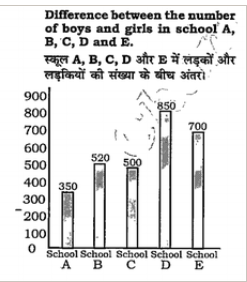 . The number of boys in school B
is what percentage of the number of students in that school?
निम्नांकित बार ग्राफ का अध्ययन कीजिए और उसके बाव दिए गए प्रश्न का उत्तर दीजिए।

 . स्कूल B में लड़कों की संख्या, उस स्कूल में
विद्यार्थियों की कुल संख्या की कितने प्रतिशत है?
0.5
0.55
0.4
0.6
Step by step video solution for Study the following bar graph and answer the questions given below. . The number of boys in school B is what percentage of the number of students in that school? निम्नांकित बार ग्राफ का अध्ययन कीजिए और उसके बाव दिए गए प्रश्न का उत्तर दीजिए। . स्कूल B में लड़कों की संख्या, उस स्कूल में विद्यार्थियों की कुल संख्या की कितने प्रतिशत है? by Maths experts to help you in doubts & scoring excellent marks in Class 14 exams.
Updated on:21/07/2023Topper's Solved these Questions
Similar Questions
Study the following bar graph and answer the questions given below.
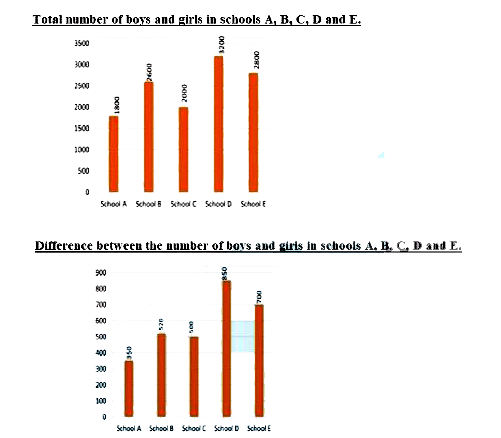
The number of boys in school B is what percentage of the total number of students in that school ?
View SolutionStudy the following pie chart and table to answer the question.Total number of students admitted in a university in various fields = 5000 Distribution of the number of students into various fields:
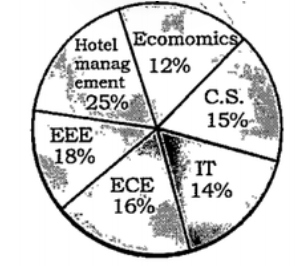
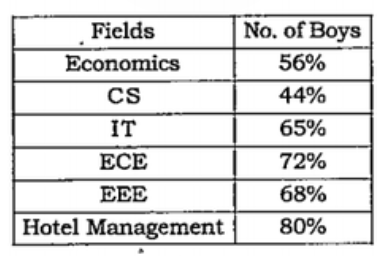
The ratio of the number of boys in Economics to the number of students in Economics is:
निम्नांकित पाई चार्ट का अध्ययन कीजिए और उसके बाद दिए गए प्रशन का उत्तर दीजिए। एक विश्वविद्यालय में विभिन्न संकायों में प्रवेश लेने वाले विद्यार्थियों की संख्या 5000 है। विभिन्न संकायों में विद्यार्थियों को संख्या का बंटनः
 इकोनॉमिक्स में लड़कों की संख्या का, इकोनॉमिक्स में कुल विद्यार्थियों की संख्या से क्या अनुपात हे?
View SolutionStudy the following pie chart and table to answer the question.Total number of students admitted in a university in various fields = 5000 Distribution of the number of students into various fields:
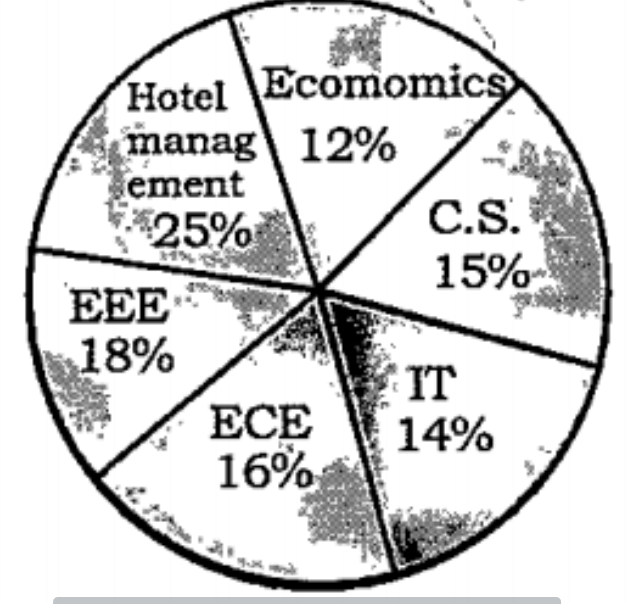
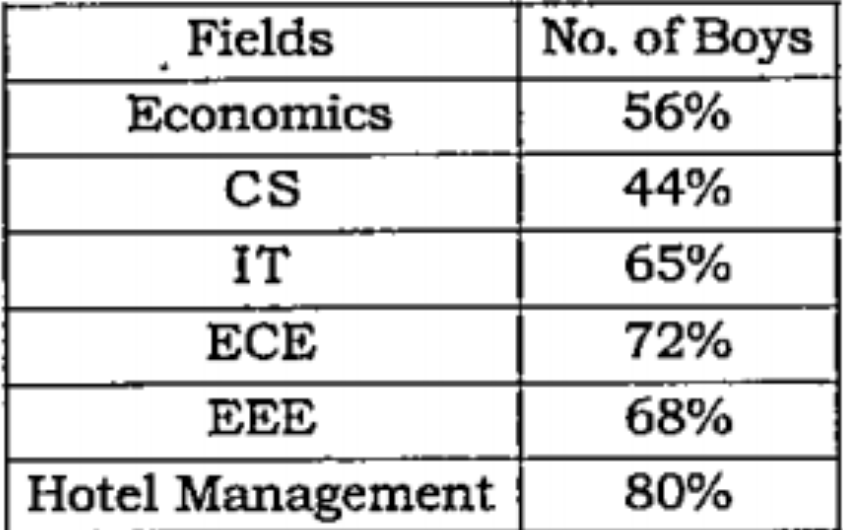 What is the average number of boys in CS, ECE and EEE fields?
निम्नांकित पाई चार्ट का अध्ययन कीजिए और उसके बाद दिए गए प्रशन का उत्तर दीजिए। एक विश्वविद्यालय में विभिन्न संकायों में प्रवेश लेने वाले विद्यार्थियों की संख्या 5000 है। विभिन्न संकायों में विद्यार्थियों को संख्या का बंटनः
CS, ECE और EEE संकायों में लड़कों की औसत संख्या कितनी है?
View SolutionStudy the given graph and answer the question that follows. The number of patients aged 10 or more years but below 40 years is what per cent less than the number of patients aged 50 or more years but below 80 years?
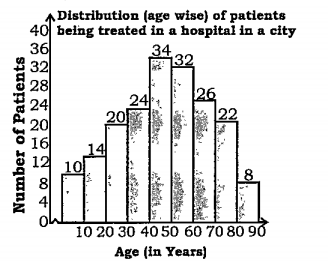
दिए गए ग्राफ का अध्ययन करें और नीचे दिए गए प्रश्न का उत्तर दें । 10 या उससे अधिक वर्ष लेकिन 40 वर्ष से कम आयु वालें मरीजों की संख्या, 50 वर्ष या उससे अधिक लेकिन 80 वर्ष से कम आयु वाले मरीजों को संख्या से कितने प्रतिशत कम हैं?
View SolutionStudy the following bar graph and answer the questions given below.
निम्नांकित बार ग्राफ का अध्ययन कीजिए और उसके बाद दिए गए प्रशन का उत्तर दीजिए।
Total number of boys and girls in schools A, B, C, D and E.
स्कूलों A, B, C, D और E में लड़कों और लड़कियों की कुल संख्या।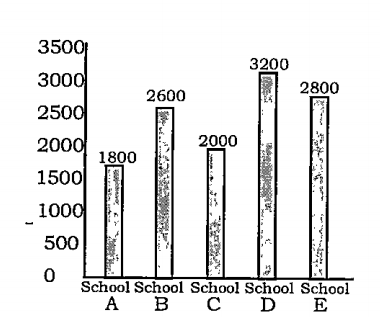
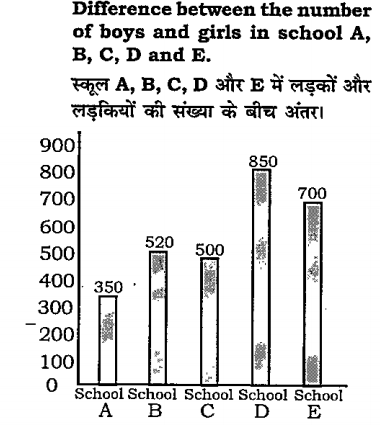
What is the difference between the number of girls in school A and the number of girls in school C?
स्कूल A में लड़कियों कीं संख्या और स्कूल C में लड़कों की संख्या में कितना अंतर है?
View SolutionStudy the chart and answer the questions:
In which of the given years is the percentage increase in the number of hotels in comparison to the previous year, is the maximum?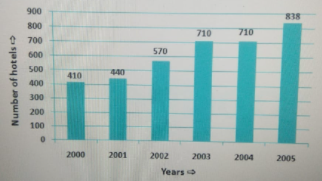
चार्ट का अध्ययन करें और प्रश्नों का उत्तर दें:पिछले वर्ष की तुलना में होटलों की संख्या में किस वर्ष में अधिकतम प्रतिशत वृद्धि हुई है?
View SolutionStudy the following bar graph and answer the questions given below.
निम्नांकित बार ग्राफ का अध्ययन कीजिए और उसके बाद गए प्रश्न का उत्तर दीजिए।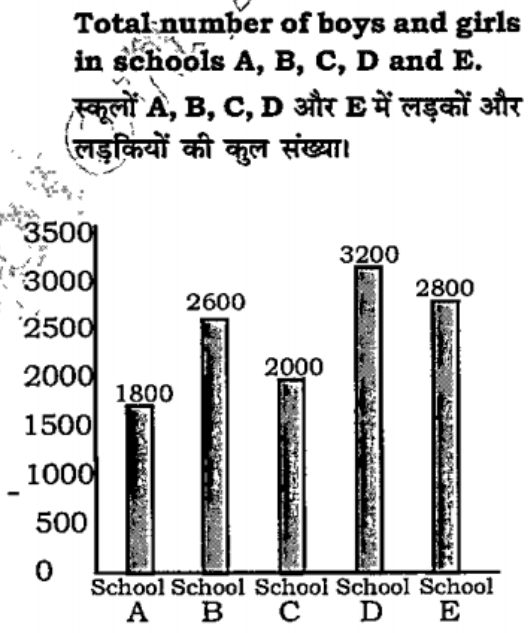 Difference between the number
of boys and girls in school A, B, C, D and E.
स्कूल A, B, C, D और E में लड़कों और लड़कियों की संख्या के बीच अंतर।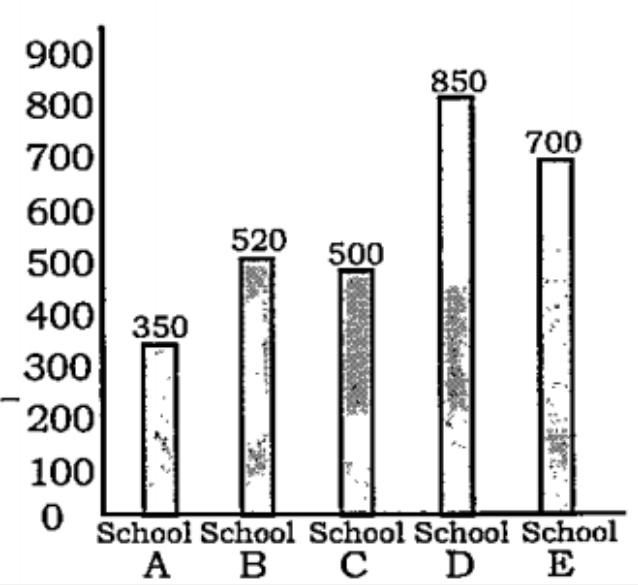 What is the ratio of number of boys to the number of girls in school E?
स्कूल E में लड़कों की संख्या से अनुपात कितना है?
View SolutionStudy the following Bar graph and answer the question. The Bar graph gives the annual rates of inflation in percentages for 1975 and 1987:
निम्नलिखित बार-ग्राफ का अध्ययन करें और प्रश्नों का उत्तर दें। बार-ग्राफ में वर्ष 1975 से 1987 तक प्रतिशत में मुद्रा स्फीति की वार्षिक दर प्रतिशत में दी गई है :
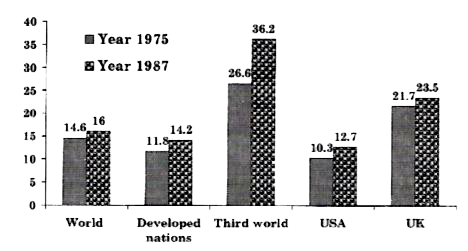
The change in rate of inflation was least in which of the following.
मुद्रास्फीति के परिवर्तन की निम्नतम दर इन में से कहाँ थी?
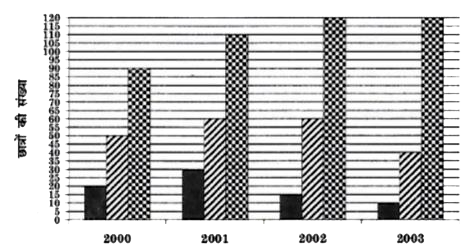
View SolutionThe graph shows the result of 10th class students of a school for 4 years. Study the graph and answer the questions:
The number of students appeared for the 10th class exam in the year 2002 is.
निम्नलिखित दण्ड आरेख 10 वीं कक्षा के छात्रों का 4 वर्ष का परीक्षा परिणाम दर्शाता है। आरेख का अध्ययन कीजिए और निम्नलिखित प्रश्नों का उत्तर दीजिए : छात्रों की संख्या
वर्ष 2002 में 10 वीं कक्षा की परीक्षा में शामिल छात्रों की संख्या बताइए:
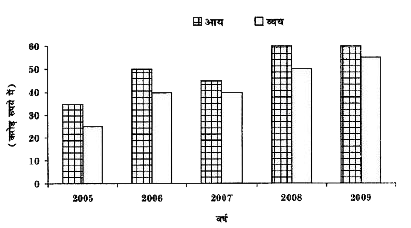
View SolutionStudy the following graph which shows income and expenditure of a company over the years and answer the questions.
In how many years was the expenditure of the company more than the average expenditure of the given years?
निम्नलिखित चार्ट का अध्ययन कीजिए जिसमें कंपनी की कुछ वर्षों की आय एवं उसके व्यय को दर्शाया गया है और प्रश्नों के उत्तर दीजिए :
कितने वर्षों में कंपनी का व्यय दिए गए वर्षों के औसत व्यय से अधिक था?
View Solution
