The median date of the year 2019, given in the form of DD.MM, is
DD.MM के रूप में लिखित, वर्ष 2019 की माध्यमिका-तिथि (मीडियन डेट) है:
01.07
30.06
02.07
03.07
To find the median date of the year 2019, we need to follow these steps:
Step 1: Determine the total number of days in 2019
The year 2019 is not a leap year, so it has a total of 365 days.
Step 2: Calculate the position of the median
Since 365 is an odd number, the median position can be calculated using the formula:
Median Position=365+12=183
This means the median date is the 183rd day of the year.
Step 3: Count the days in each month to find the 183rd day
Now, we will count the cumulative days for each month until we reach the 183rd day:
- January: 31 days
- February: 28 days (not a leap year)
- March: 31 days
- April: 30 days
- May: 31 days
- June: 30 days
Now, we add these up:
- End of January: 31 days
- End of February: 31 + 28 = 59 days
- End of March: 59 + 31 = 90 days
- End of April: 90 + 30 = 120 days
- End of May: 120 + 31 = 151 days
- End of June: 151 + 30 = 181 days
At the end of June, we have 181 days.
Step 4: Determine the 183rd day
Since we have 181 days by the end of June, the 183rd day will be:
183−181=2
This means the 183rd day is the 2nd day of July.
Step 5: Write the median date in DD.MM format
Thus, the median date of the year 2019 in the format DD.MM is:
Median Date=02.07
Final Answer
The median date of the year 2019 is 02.07.
---
The year 2019 is not a leap year, so it has a total of 365 days.
Since 365 is an odd number, the median position can be calculated using the formula:
Median Position=365+12=183
This means the median date is the 183rd day of the year.
Now, we will count the cumulative days for each month until we reach the 183rd day:
- January: 31 days
- February: 28 days (not a leap year)
- March: 31 days
- April: 30 days
- May: 31 days
- June: 30 days
- End of January: 31 days
- End of February: 31 + 28 = 59 days
- End of March: 59 + 31 = 90 days
- End of April: 90 + 30 = 120 days
- End of May: 120 + 31 = 151 days
- End of June: 151 + 30 = 181 days
Since we have 181 days by the end of June, the 183rd day will be:
183−181=2
This means the 183rd day is the 2nd day of July.
Thus, the median date of the year 2019 in the format DD.MM is:
Median Date=02.07
The median date of the year 2019 is 02.07.
Topper's Solved these Questions
Similar Questions
The following table gives the details of five commodities A,B,C,D and E with quantity required and their cost for a family in a month. Study the table and answer the questions that follow.
निम्नलिखित तालिका पाँच वस्तुओं A, B, C, D तथा E के बारे में बताती है कि एक महीने में एक परिवार को उनकी कितनी मात्रा की आवश्यकता है तथा उनकी लागत कितनी है | इस तालिका का अध्ययन करें तथा फिर पूछे गए प्रश्नों के उत्तर दें |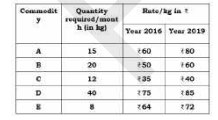 The amount spent extra on commodities B and C in the year 2019 as compared to that in the
year 2016 is:
वर्ष 2016 की तुलना में वर्ष 2019 में वस्तु B तथा C पर कितनी अतिरिक्त राशि खर्च की गयी है ?
View SolutionIn the following table, the production of various crops (in tonnes) is given from 2015 to 2019. Study the table and answer the question that follows:
दी गयी तालिका में, 2015 से 2019 तक विभिन्न फसलों का उत्पादन (टन में ) दिया गया है | इस तालिका का अध्ययन करें तथा फिर पूछे गए प्रश्न का उत्तर दीजिए |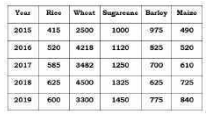 The percentage growth of maize in the year 2019 over the year 2015 is: (correct to one decimal place)
वर्ष 2019 में वर्ष 2015 की तुलना में मक्का के उत्पादन में कितने प्रतिशत की वृद्धि हुई है ? ( दशमलव के एक स्थान तक )
View Solution
Knowledge Check
In which of the following years the percentage of rise or fall in production from the previous year is maximum for the flavour of Q ?
निम्न में से किस वर्ष में, पिछले वर्ष की तुलना में गन्ध Q के उत्पादन में वृद्धि या हास अधिकतम रहा है?
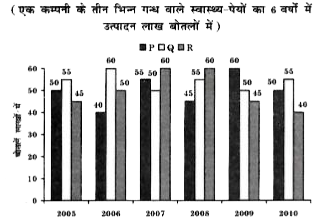 A2010B2006C2007D2009
The following line diagram represents the yearly sales figure of a company in the years 2001-2010. Examine the diagram and answer the question.
निम्नलिखित रेखा आरेख किसी कंपनी की वर्ष 2007-2010 के दौरान वार्षिक बिक्री के आंकड़ों को दर्शाता है। आरेख का अध्ययन करें और नीचे दिए गए प्रश्नों के उत्तर दें-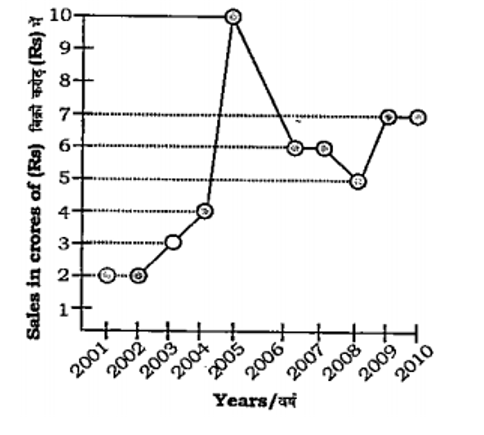 The percentage increase in sales in the year 2005 with respect to the previous year is
वर्ष 2005 में पिछले वर्ष की तुलना में बिक्री में वृद्धि का प्रतिशत है-
View SolutionThe following figure shows the number of students (in thousands) admitted and passed out per your in a college during years 2000 to 2004, study the figure and answer the questions :
: निम्नलिखित आकृति में किसी कॉलेज में वर्ष 2000 से वर्ष 2004 तक प्रति वर्ष भर्ती हुए और उर्तीण हुए छात्रों की संख्या (हजार में) दर्शायी गई है। आकृति का अध्ययन कर प्रश्नों के उत्तर दीजिए :
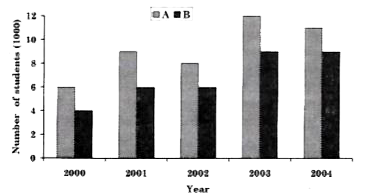
The percent increase in the number of students admitted in the year 2003 over that in 2001 is
वर्ष 2001 की तुलना में वर्ष 2003 में भर्ती हुए छात्रों की संख्या में हुई प्रतिशत वृद्धि कितनी है ?
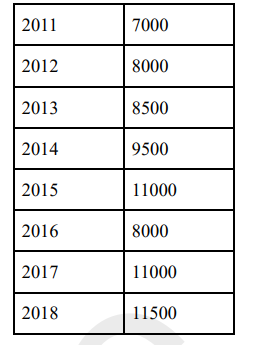
View SolutionThe bar graph given below shows the profit (in multiples of thousand rupees) of a company during the year 2010-2018. The average profit for the year 2015-2017 is what percentage more than the 2012 profit?
नीचे दिए गए दंड आरेख में वर्ष 2010-2018 के दौरान किसी कंपनी के लाभ (हजार रुपए के गुणक में) को दर्शाया गया है | वर्ष 2015-2017 का औसत लाभ 2012 के लाभ से कितना प्रतिशत अधिक है ?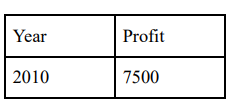
View SolutionThe given Bar Graph presents Income and Expenditure (in crores of Rupees) of a company for the five years, 2014 to 2018.
दिया गया दंड आरेख पांच वर्षों अर्थात 2014 से 2018 तक एक कंपनी के आय एवं व्यय ( करोड़ रुपये में ) को दर्शाता है |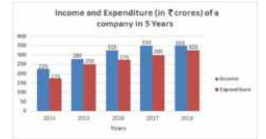 In which year is the Expenditure more than 40% as compared to the Expenditure in the previous year?
किस वर्ष में व्यय पिछले वर्ष के व्यय की तुलना में 40% अधिक है ?
View SolutionThe given bar graph shows the number of marks scored by a student in each subject in three years.
दिया गया दंड आरेख एक छात्र के द्वारा तीन वर्षो में प्रत्येक विषय में लाये गए अंकों को दर्शाता है |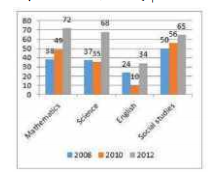 In the given chart, the number of marks in social studies in 2012 is 13% of the school strength. The number of students is:
दिए गए चार्ट में, यदि वर्ष 2012 में सामाजिक अध्ययन में अंकों की संख्या स्कूल की के छात्रों की संख्या का 13% है। छात्रों की संख्या कितनी है?
View SolutionThe bar chart shows the annual food grain production (in million tonnes) for years 2012-2017. For how many years is the production less than the average production during the given period?
यह दंड आरेख वर्ष 2012-2017 की अवधि में वार्षिक खाद्यान्न उत्पादन (मिलियन टन में ) को दर्शाता है | कितने वर्ष उत्पादन इस अवधि के औसत उत्पादन से कम है ?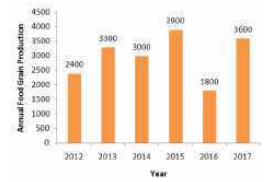
View SolutionThe following table shows the items of expenditure of a company (in ₹ lakh per annum), from 2015 to 2019.
निम्नलिखित तालिका 2015-2019 तक एक कंपनी के व्यय की मदों को ( लाख रुपये प्रति वर्ष में ) दर्शाती है | What is the average amount of interest per year which the company had to pay during this
period?
इस अवधि के दौरान प्रति वर्ष कंपनी को ब्याज की कितनी औसत राशि का भुगतान करना पड़ा है ?
View Solution
