The marks obtained by various students have been shown in the data given below.
नीचे दिए गए आंकड़े विभिन्न छात्रों द्वारा प्राप्त अंको को दर्शाया गया है
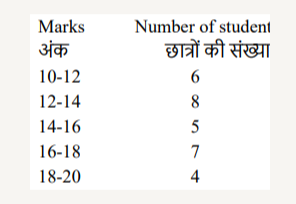
What is the mean marks ( correct
to two decimal places ) of the given data ?
दिए गए आंकड़े का माध्य अंक (दो दशमलव स्थान तक ) कितना है
13.67
13.33
14.67
15.33
The correct Answer is:C
Step by step video & image solution for The marks obtained by various students have been shown in the data given below. नीचे दिए गए आंकड़े विभिन्न छात्रों द्वारा प्राप्त अंको को दर्शाया गया है What is the mean marks ( correct to two decimal places ) of the given data ? दिए गए आंकड़े का माध्य अंक (दो दशमलव स्थान तक ) कितना है by Maths experts to help you in doubts & scoring excellent marks in Class 14 exams.
Updated on:21/07/2023Topper's Solved these Questions
Similar Questions
The Table given below presents the marks obtained by three students in five examinations.
नीचे दी गयी तालिका पांच परीक्षाओं के तीन विषयों में छात्रों के द्वारा प्राप्त किये गए अंकों को दर्शाती है |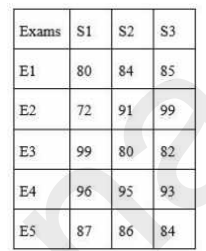 What is the average of marks obtained by S3 per exam?
S3 द्वारा हर परीक्षा में प्राप्त किये गए अंकों का औसत कितना है ?
View SolutionThe data below shows the number of batsman having different batting averages.
नीचे दिए गए आंकड़ों में विभिन्न बल्लेबाजी औसत वाले बल्लेबाजों की संख्या को दर्शाया गया है |
<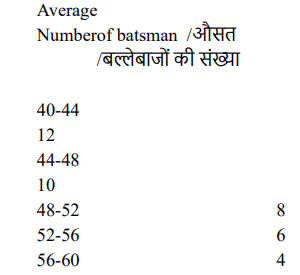
What is the mean batting average per batsman ?
प्रति बल्लेबाज माध्य बललेबाज़ी औसत कितना है ?
View SolutionThe weight of 20 students has been shown in the table given below :
निम्न तालिका में 20 छात्रों के वजन को दर्शाया गया है -
What are the Mode and the Median of the data given above respectively ?
उपरोक्त आँकड़ों का क्रमश: बहुलक (Mode) और माधियका (Median) क्या हैं?
View SolutionIn the given histogram, what is the mean marks of the students, correct to one decimal place?
दिए गए आयतचित्र के अनुसार एक दशमलव स्थान तक छात्रों का माध्य अंक क्या है ?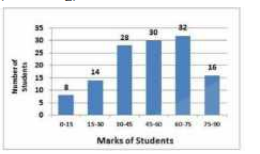
View SolutionWhat is the mode of the given data
दिए गए आंकड़ों का बहुलक कितना है ? 4,3,4,3,2,2,2,5,5,3,4,6,4,3,3
View SolutionThe Table given below presents the marks obtained by three students in five examinations.
नीचे दी गयी तालिका पांच परीक्षाओं के तीन विषयों में छात्रों के द्वारा प्राप्त किये गए अंकों को दर्शाती है |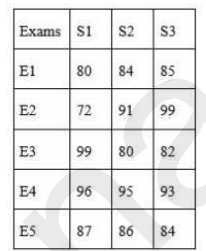 What is the sum of marks obtained by S1 in Exam E4, S2 in Exam E1, S3 in Exam E3 and E5?
S1 के द्वारा परीक्षा E4 में, S2 के द्वारा परीक्षा E1 में, तथा S3 के द्वारा परीक्षा E3 और E5 में प्राप्त किये गए अंकों का जोड़ कितना है ?
View SolutionWhat is the difference between mean and median of the given data.
दिए गए आंकड़ों के माध्य एवं मध्यिका में क्या अंतर है ? 4,6, 3, 7,10, 13, 16 and 5 ?
View SolutionThe bar graph given below presents the marks (out of 100) obtained by 10 students in a subject.
यह दंड आरेख एक विषय में 10 छात्रों के प्राप्तांक ( 100 में से ) को दर्शाता है |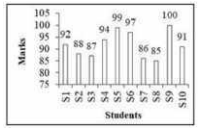 What is the average of the marks obtained by all the students?
सभी छात्रों के द्वारा प्राप्त किये गए अंकों का औसत क्या है ?
View SolutionIn the given histogram,what is the mean height of all students correct to one decimal place? /
दिए गए आयतचित्र में, एक दशमलव स्थान तक सभी छात्रों की औसत लंबाई क्या है?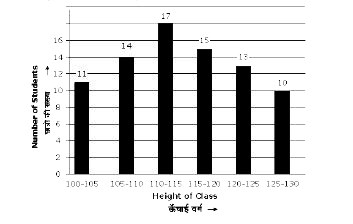
View SolutionThe data given below presents number of households corresponding to the number of children residing therein.
नीचे दिए गए आंकड़ें घरों की संख्या तथा उनमें रहने वाले बच्चों की संख्या को दशति हैं |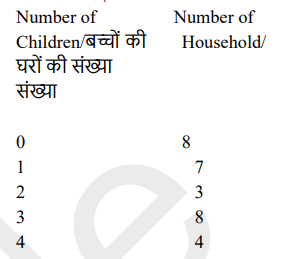
What is the difference (correct up to two decimal places) between the mean and the median of the number of the children?
बच्चों की संख्या के माध्य एवं मध्यिका में क्या अंतर ( दशमलव के दो स्थान तक ) है ?
View Solution
