The heights of students are given in cm as 161, 190, 185, 163, 172, 180, 162. The median height of the student is:
छात्रों की लंबाई सेमी में दी गयी है : 161, 190, 185, 163, 172, 180, 162 छात्रों की मध्यिका ऊंचाई है :
131
172
170
180
Step by step video & image solution for The heights of students are given in cm as 161, 190, 185, 163, 172, 180, 162. The median height of the student is: छात्रों की लंबाई सेमी में दी गयी है : 161, 190, 185, 163, 172, 180, 162 छात्रों की मध्यिका ऊंचाई है : by Maths experts to help you in doubts & scoring excellent marks in Class 14 exams.
Updated on:21/07/2023Topper's Solved these Questions
Similar Questions
The average height of 12 students of a class is 132.5 cm. If one more student joins, the average height becomes 131.2 cm, the height of the new student is:
एक कक्षा के 12 छात्रों की औसत ऊँचाई 132.5 सेमी है। यदि एक और छात्र आ जाता है, तो औसत ऊंचाई 131.2 सेमी हो जाती है, नए छात्र की ऊंचाई कितनी है?
View SolutionThe average height of 5 boys is 175 cm. A sixth boy joined the group and the average height of all the boys in the group now increased by one centimeter. The height of the sixth boy is:
5 लड़कों की औसत लंबाई 175 सेमी है | एक छठा लड़का समूह में शामिल हो जाता है तथा सभी लड़कों की औसत लंबाई एक सेमी से बढ़ जाती है | छठे लड़के की लंबाई कितनी होगी ?
View Solution
Knowledge Check
In a college, 40% of the students were allotted group A, 75% of the remaining were given group B and the remaining 12 students. were given group C. Then the number of students who applied for the group is
AA. 92BB. 100CC. 60DD. 80
In the given bar graph, the percentage decrease in the number of students in Institute A in 2016 is what percent of students in 2015.
इस दंड आरेख में संस्थान A में 2016 में छात्रों की संख्या में प्रतिशत कमी 2015 के छात्रों की संख्या का क्या प्रतिशत है ?
View SolutionThe given histogram shows the height of the students:
दिए गए हिस्टोग्राम छात्रों की लम्बाई को दर्शाता है
The number of students whose height is in the class interval 165-170 is what percentage less than the number of students whose height is in the interval 150-155?
कक्षा अंतराल 165-170 में जिन छात्रों की लम्बाई है, उन छात्रों की संख्या प्रतिशत में कितना कम है लम्बाई अंतराल 150-155 से ज्ञात करे |
View SolutionThe heights of 50 students, measured to the nearest centimetres, have been found to be as follows: 161 150 154 165 168 161 154 162 150 151
162 164 171 165 158 154 156 172 160 170
153 159 161 170 162 165 166 168 165 164
154 152 153 156 158 162 160 161 173 166
161 159 162 167 168 159 158 153 154 159
What can you conclude about their heights from the table?
View SolutionThe heights of 50 students, measured to the nearest centimetres, have been found to be as follows: 161 150 154 165 168 161 154 162 150 151
162 164 171 165 158 154 156 172 160 170
153 159 161 170 162 165 166 168 165 164
154 152 153 156 158 162 160 161 173 166
161 159 162 167 168 159 158 153 154 159
Represent the data given above by a grouped frequency distribution table, taking the class intervals as 160-165, 165-170, etc.
View SolutionThe heights of 50 students, measured to the nearest centimetres, have been found to be as follows: 161,150,154,165,168,161,154,162,150,151,162,164,171,165,158,154,156,172,160,170,153,159,161,170,162,165,166,168,165,164,154,152,153,156,158,162,160,161,173,166,161,159,162,167,168,159,158,153,154,159,
(i) Represent the data given above by a grouped frequency distribution table, taking the class intervals as 160−165,165−170, etc.
(ii) What can you conclude about their heights from the table?
View SolutionThe given pie chart shows the percentage of students enrolled for the courses A, B, C, D and E in a university and the table shows the percentage of students that passed, out of the enrolled students.
दिया गया पाई चार्ट एक विश्वविद्यालय में पाठ्यक्रम A, B, C, D और E के लिए नामांकित छात्रों के प्रतिशत को दर्शाता है और तालिका उन छात्रों का प्रतिशत दिखाती है, जो नामांकित छात्रों में से उत्तीर्ण हुए हैं।
 If the total number of students is 60000, then the total number of students who did not pass in the
courses A, C is:
यदि छात्रों की कुल संख्या 60000 है, तो कुल छात्रों की संख्या, जो पाठ्यक्रम A, C में उत्तीर्ण नहीं हुए हैं:
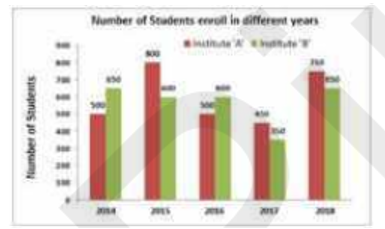
View SolutionThe given Bar Graph presents the number of students enrolled for a vocational course in institutes A and B during a period of five years.
दिया गया दंड आरेख A और B संस्थानों में पांच वर्षों की अवधि के दौरान व्यावसायिक पाठ्यक्रमों नामांकन लेने वाले छात्रों की संख्या को दर्शाता है | The average number of students (per year) enrolled in B during 2015, 2016 and 2018 is what
percentage more than the number of students enrolled in A during 2017?
2015, 2016 और 2018 में B में नामांकन ( प्रति वर्ष ) लेने वाले छात्रों की औसत संख्या 2017 के दौरान A में नामांकन लेने वाले छात्रों की संख्या से कितना प्रतिशत अधिक है ?
View Solution
