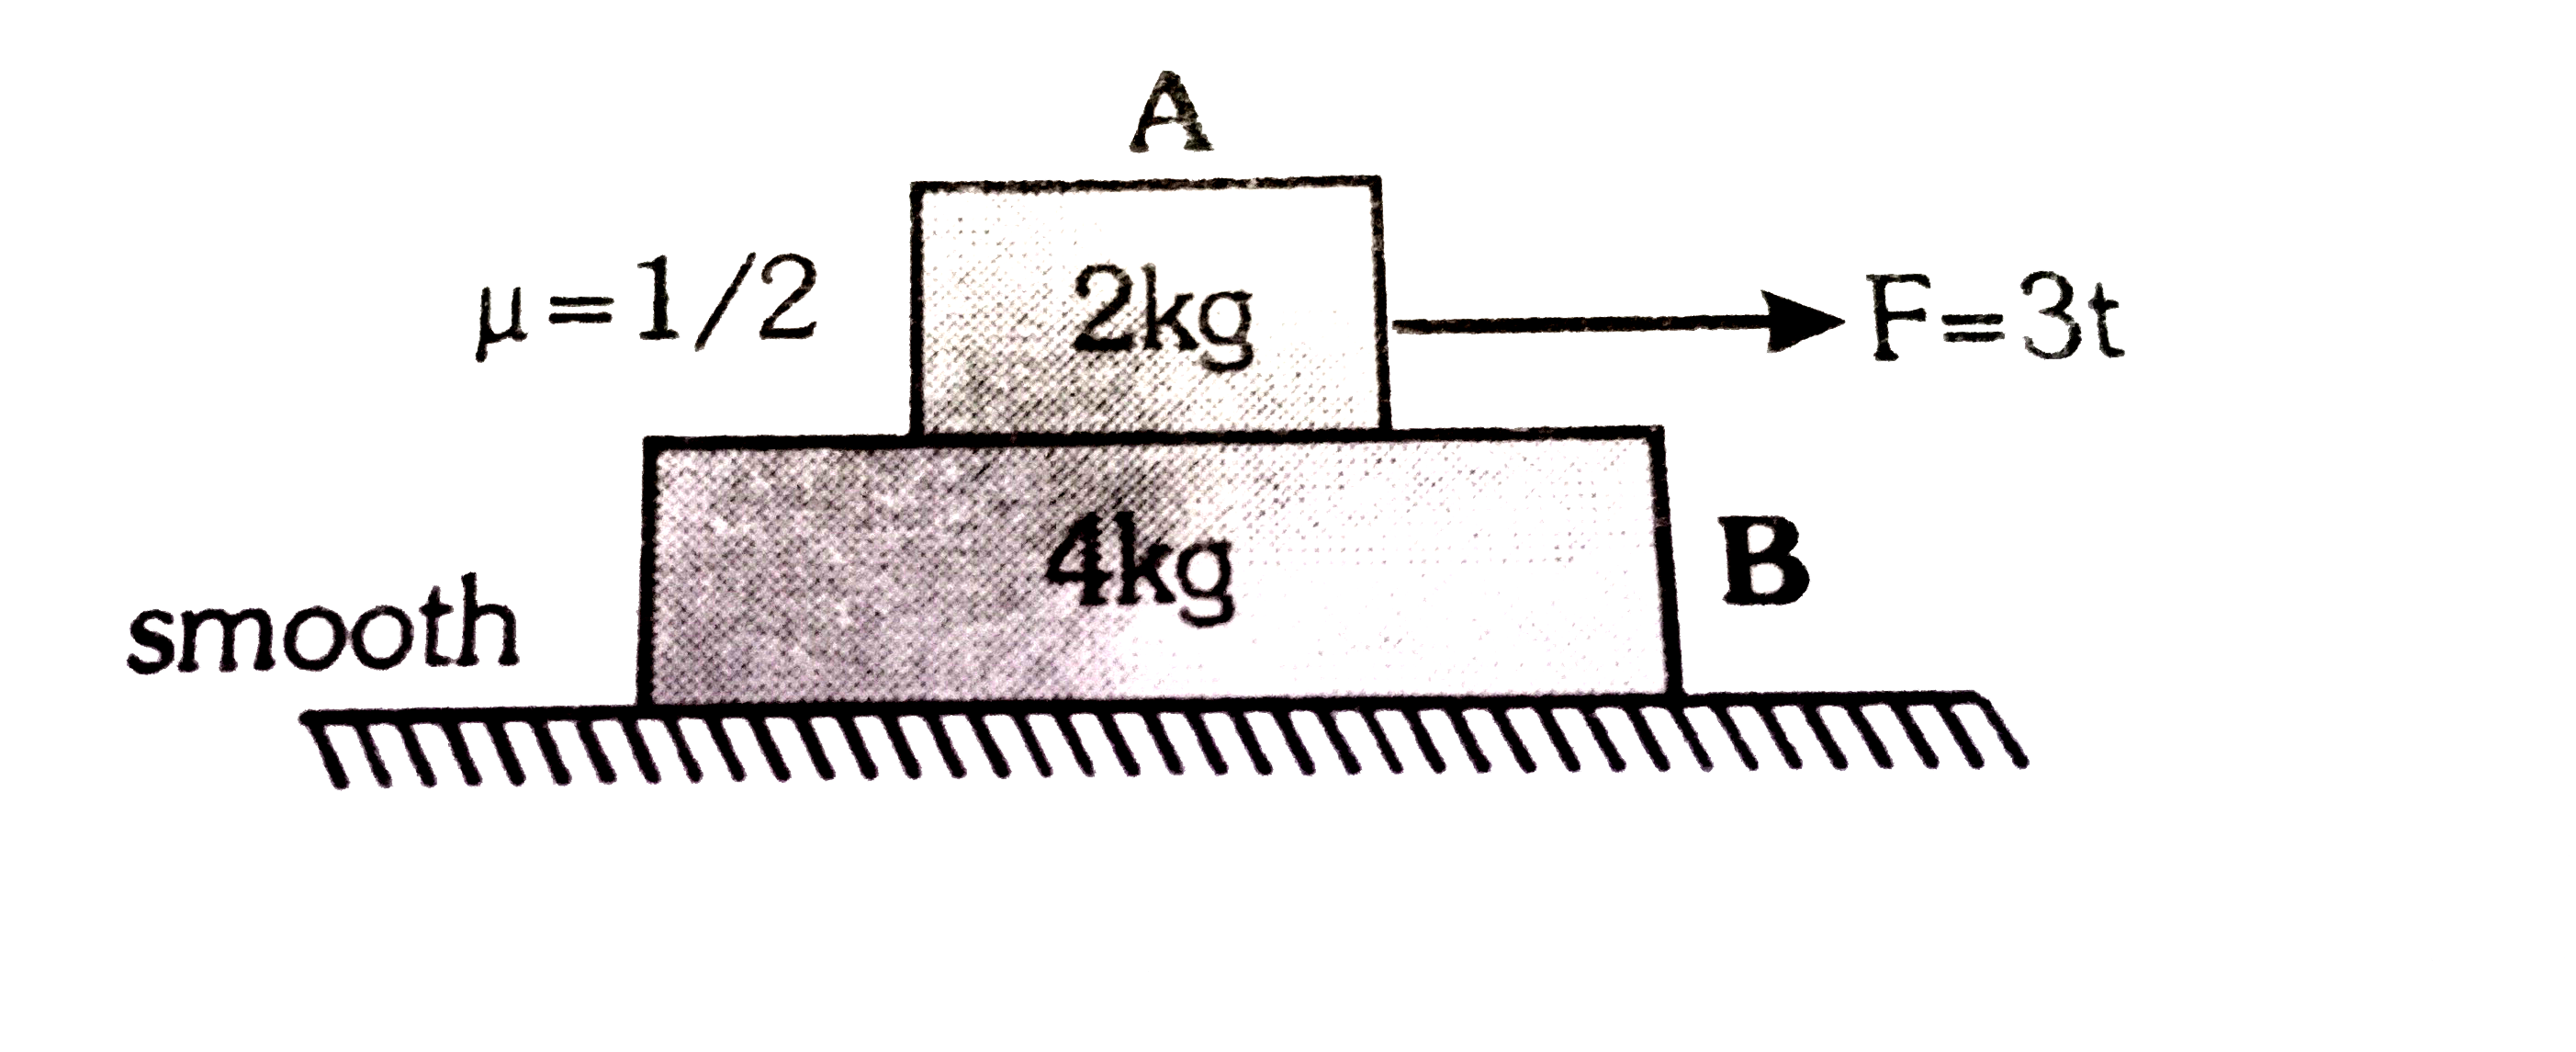
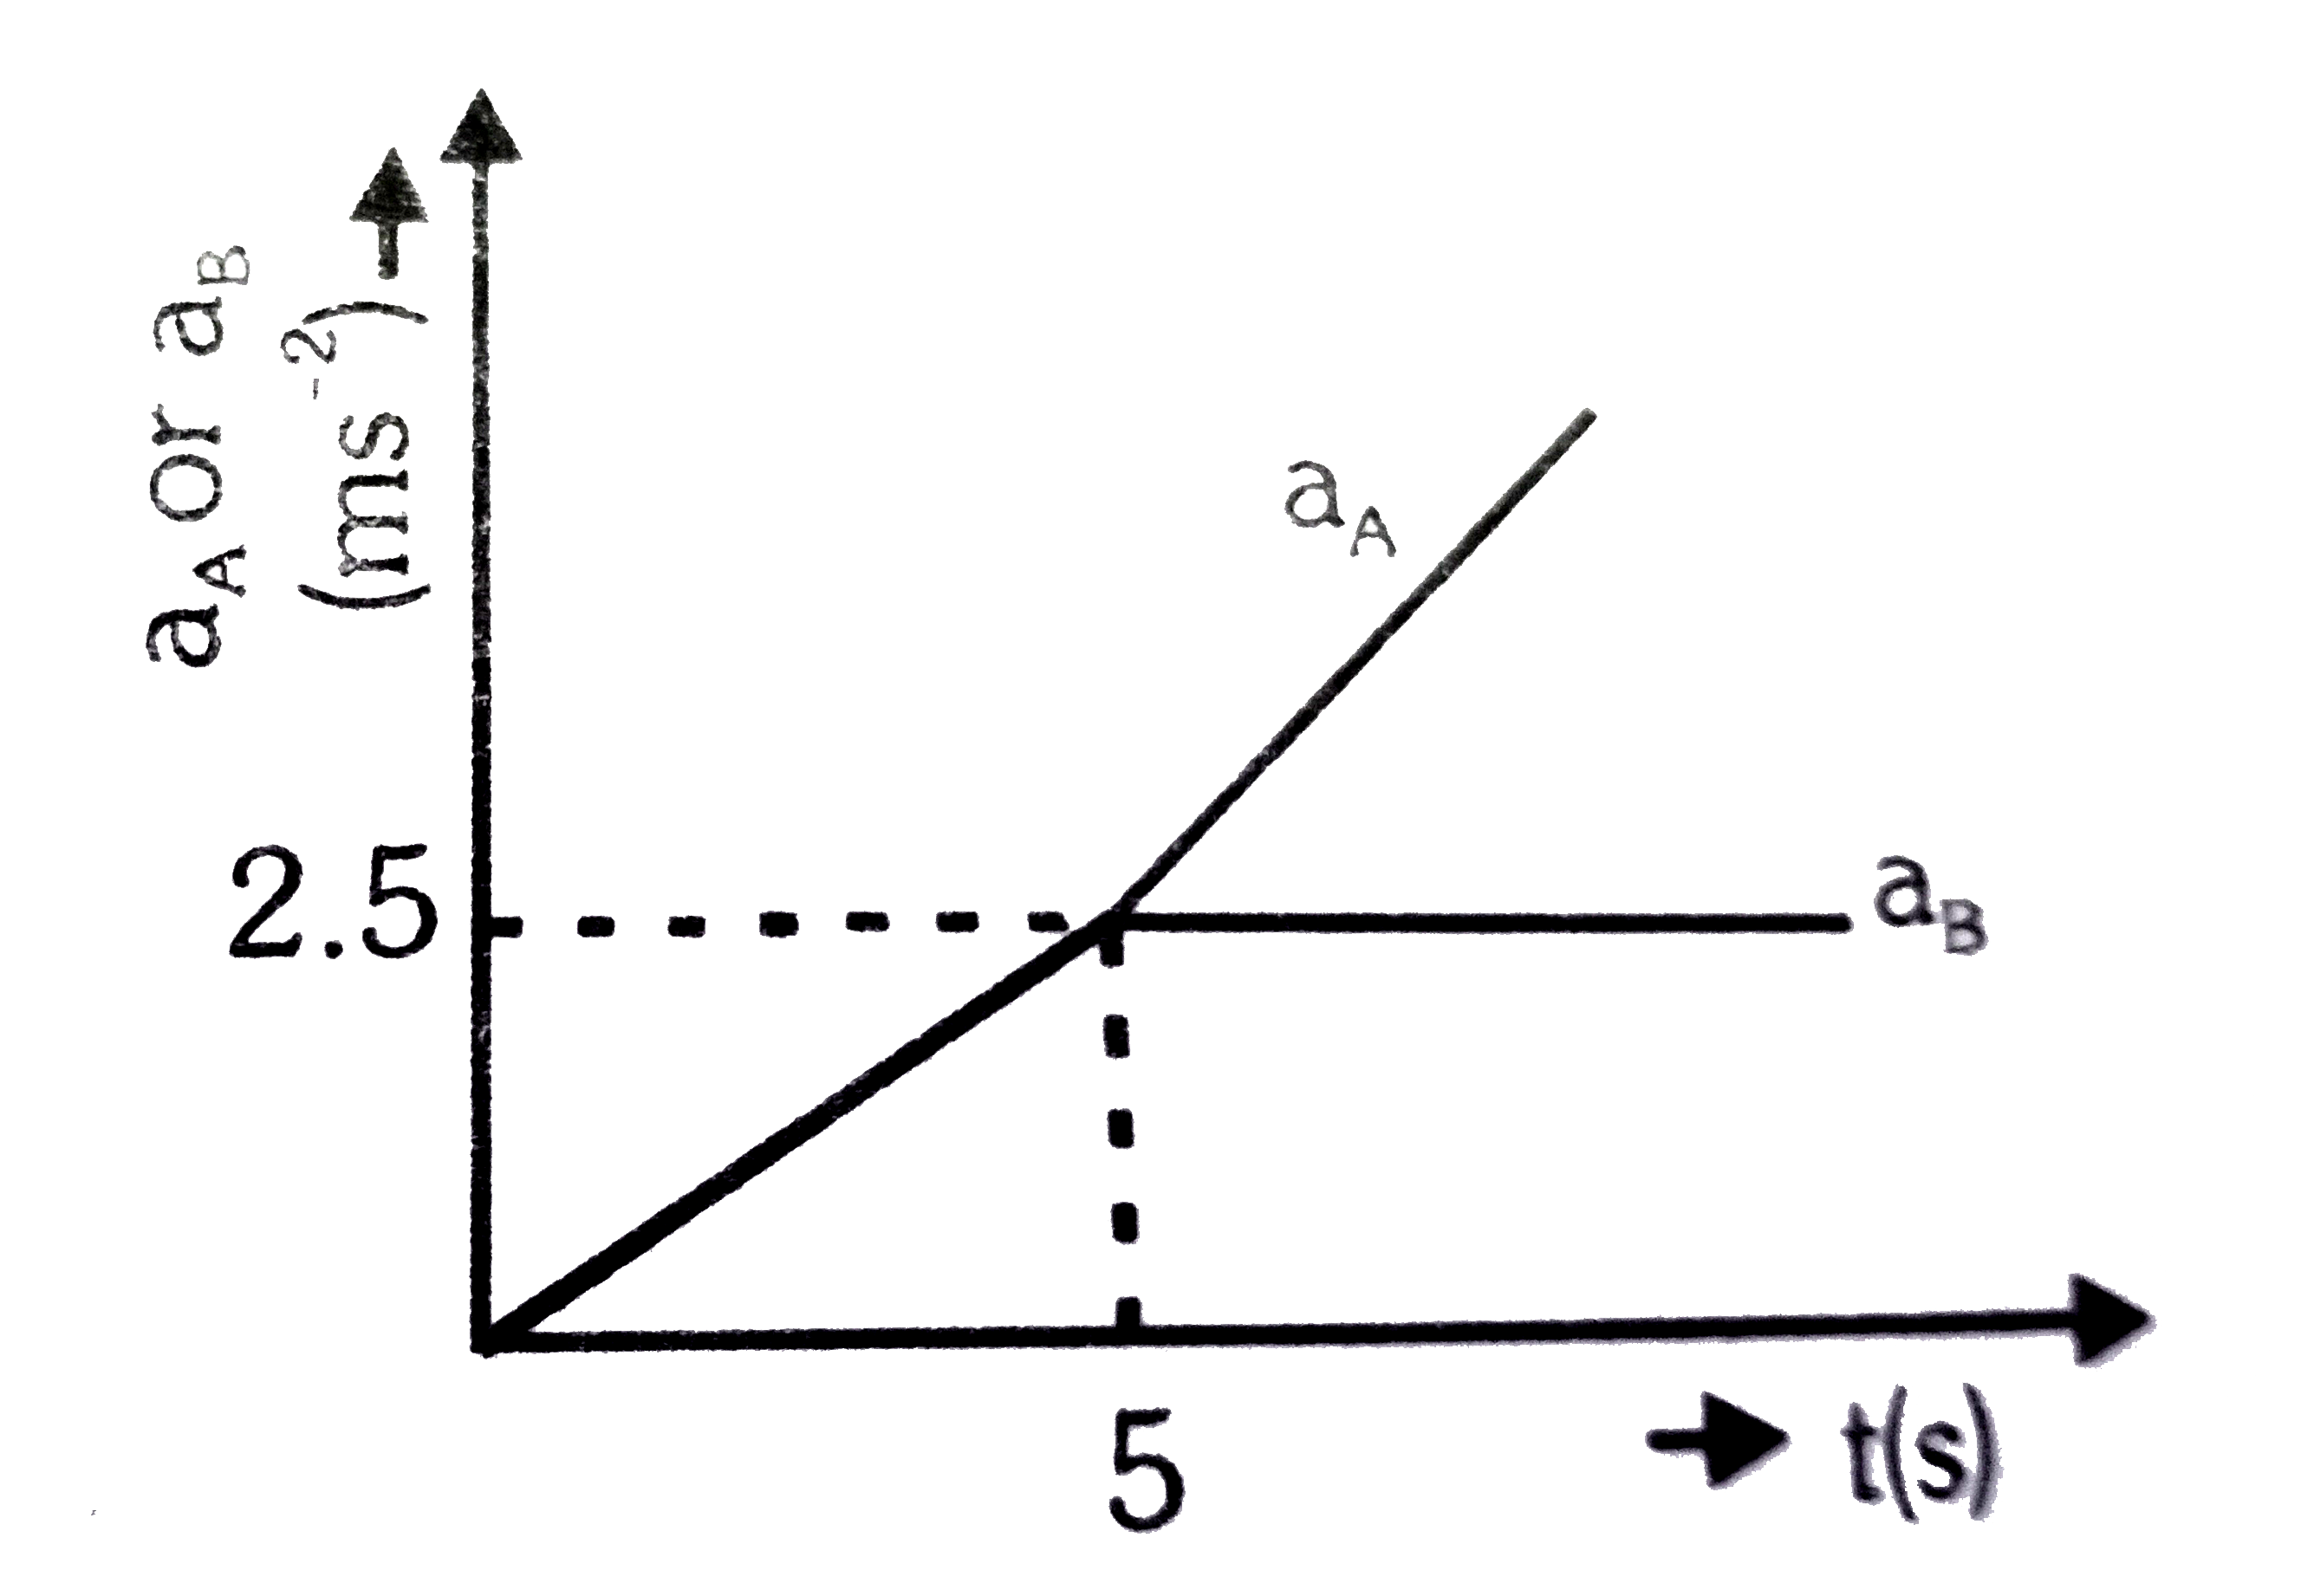
For shown situation draw a graph showing acceleration of A and B on y-axis and time on x-axis (g=10ms−2)
 Solution in Gujrati
Limiting fricition between A&B,f1=μmAg=(12)(2)(10)=10N
Block B moves due to friction only. So maximum acceleration of
B,amax=f1mB=104−2.5ms−2. So both the blokcs move together till the common acceleration becomes 2.5ms−2, after that acceleration of B will become constant while that of A will go on increasing. Slipping will starts between A&B at 2.5ms−2⇒2.5=FmA+mB=3t6⇒t=5s
Hence for ≤5s,aA=aB=FmA+mB=3t6=12
and for t>5saB=2.5ms−2aA=F−f1mA=3t−102=32t−5

Topper's Solved these Questions
- NEWTONS LAWS OF MOTIONBOOK - ALLEN CHAPTER - NEWTONS LAWS OF MOTIONEXERCISE - EXERCISE-I
52 Videos
- NEWTONS LAWS OF MOTIONBOOK - ALLEN CHAPTER - NEWTONS LAWS OF MOTIONEXERCISE - EXERCISE-II
112 Videos
- NEWTONS LAWS OF MOTIONBOOK - ALLEN CHAPTER - NEWTONS LAWS OF MOTIONEXERCISE - EXERCISE-III
28 Videos
- NEWTON'S LAWS OF MOTION & FRICTIONBOOK - ALLEN CHAPTER - NEWTON'S LAWS OF MOTION & FRICTIONEXERCISE - EXERCISE (JA)
4 Videos
- RACEBOOK - ALLEN CHAPTER - RACEEXERCISE - Basic Maths (Wave Motion & Dopplers Effect) (Stationary waves & doppler effect, beats)
25 Videos
Similar Questions
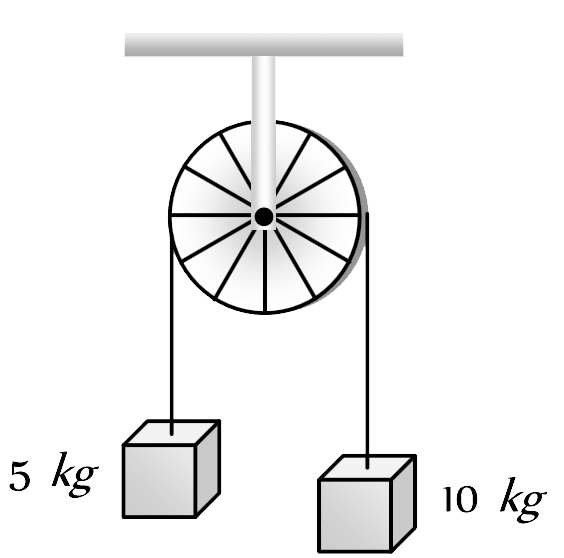
USS 150) Two masses of 5 kg and 10 kg are connected to a pulley as shown. What will be the acceleration of the system (g= acceleration due to gravity)

View SolutionA particle is in straight line motion with uniform velocity A force is not required
View SolutionAssertion: The driver in a vechicle moving with a constant speed on a straight road is in a non-inertial frame of referance.
Reason: A reference frame in which Newton's laws of motion are applicable is non-inertial.
View SolutionA piece of wire is bent in the shape of a parabola y=kx2 (y-axis vertical) with a bead of mass m on it. The bead can slide on the wire without friction. It stays at the lowest point of the parabola when the wire is at rest. The wire is now accelerated parallel to the x-axis with a constant acceleration a. The distance of the new equilibrium position of the bead, where the bead can stay at rest with respect to the wire, from the y-axis is:
View SolutionThe frequency of a radar is 780 MHz. After getting reflected from an approaching aeroplane, the apparent frequency is more than the actual frequency by 2.6 kHz. The aeroplane has a speed of
View SolutionIn a graph of population, on x-axis time and on y-axis population is plotted. A parallel line to x-axis shows:
View Solutionसमान अक्ष पर y=sinx तथा y=2sinx के आलेख खींचे ।
View SolutionPlotting a graph for momentum on the X-axis and time on Y-axis . Slope of momentum - time graph gives _________
View SolutionDraw the acceleration-time graphs for the given velocity-time graphs of a particle moving along x-axis.

View SolutionIn a graph of population, on x-axis time and on y-axis population is plotted. A parallel line to x-axis shows:
View SolutionPlotting a graph for momentum on the X-axis and time on Y-axis. Slope of momentum-time graph gives …………………………………...
View SolutionPlotting a graph for momentum on the X-axis and time on Y-axis. Slope of momentum-time graph gives …………………………………...
View Solutionसमीकरण 3x+y=6 का ग्राफ खींचे तथा उन बिन्दुओ का निर्देशांक ज्ञात करे जहाँ ग्राफ x- अक्ष एव y-अक्ष को काटता है
View Solutionthe equation 3x+2y=9 Draw the graph of and find the coordinates of the points where the graph intersects the x-axis and y-axis.
View Solutionचित्र में प्रदर्शित ग्राफ में समय, x-अक्ष के अनुदिश है तो प्रक्षेप्य गति में y -अक्ष पर कौनसी राशि होनी चाहिए ?

View SolutionY-अक्ष पर सेण्टीग्रेड और X- अक्ष पर संगत फारेनहाइट को लेकर एक ग्राफ आलेखित किया जाता है। यह है एक -
View Solution
