Answer the following questions:
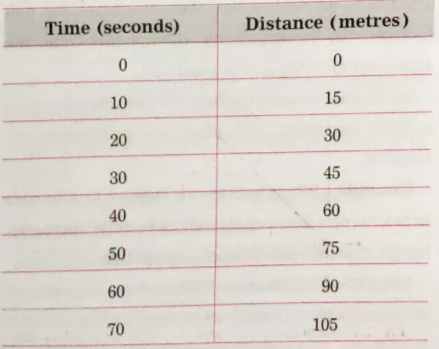
The following table shown the distance covered by a car in fixed time intervals. Draw a graph of distance against time taking 'time' along the X-axis and 'distance' along the Y-axis.
 Solution in Marathi
Step by step video & image solution for Answer the following questions: The following table shown the distance covered by a car in fixed time intervals. Draw a graph of distance against time taking 'time' along the X-axis and 'distance' along the Y-axis. by Physics experts to help you in doubts & scoring excellent marks in Class 9 exams.
Updated on:21/07/2023Topper's Solved these Questions
- LAWS OF MOTIONBOOK - NAVNEET PUBLICATIONCHAPTER - LAWS OF MOTIONEXERCISE - EXERCISE
196 Videos
- CURRENT ELECTRICITYBOOK - NAVNEET PUBLICATIONCHAPTER - CURRENT ELECTRICITYEXERCISE - EXERCISE
215 Videos
- MEASUREMENT OF MATTERBOOK - NAVNEET PUBLICATIONCHAPTER - MEASUREMENT OF MATTEREXERCISE - EXAMPLES
1 Videos
Similar Questions
Complete the sentences and explain them:
The minimum distance between the start and finish points of the motion of an object is called the ........ of the object.
View SolutionFill in the blanks:
The coulomb is the SI unit of………….
View SolutionWhat is the Dalton's atomic theory?
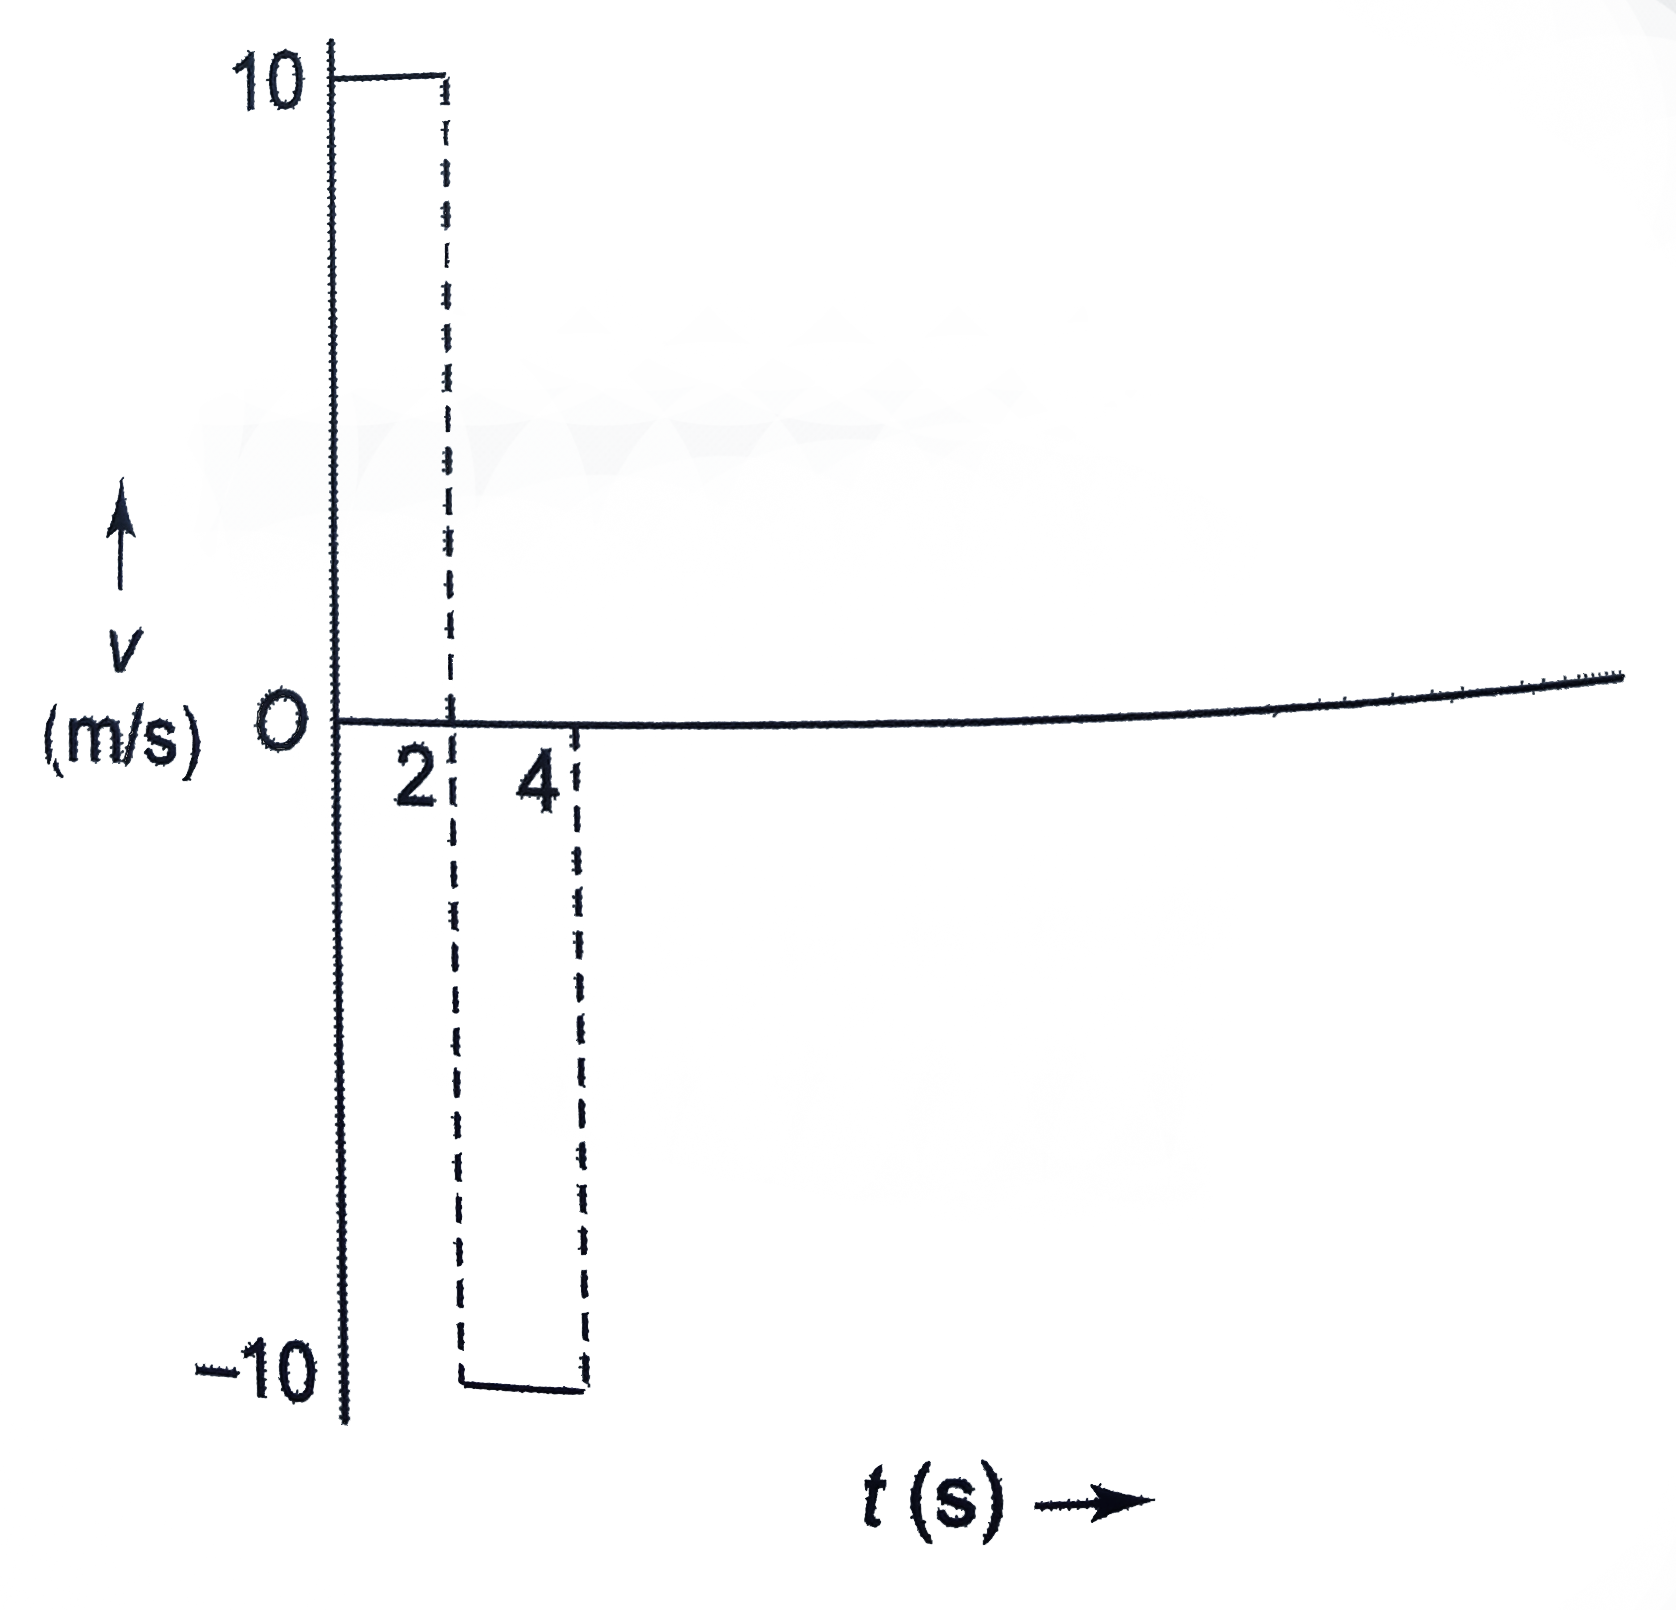
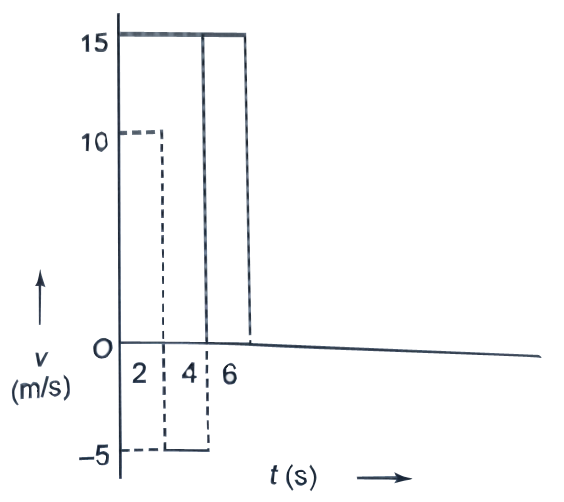
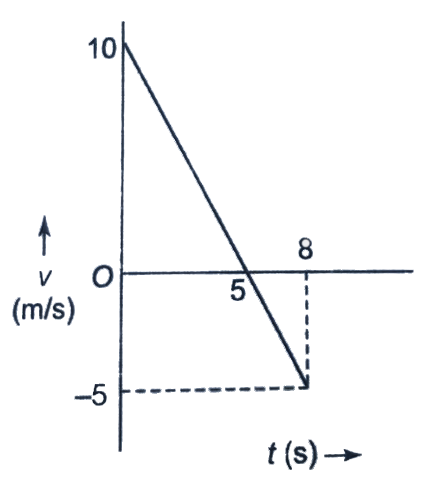
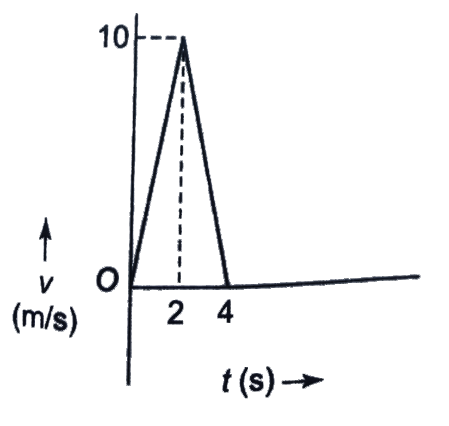
View SolutionA partical is moving along the x-axis and its velocity-time graph is shown in following diagrams. Sketch displacement-time graph.
View SolutionThe graph between the object distance along the X-axis and image distance along Y-axis for a convex lens is
View SolutionThe velocity time graph of a particle moving along a straight line is shown in the figure. In the time interval from t=0 to t=8 second, answer the following three question.
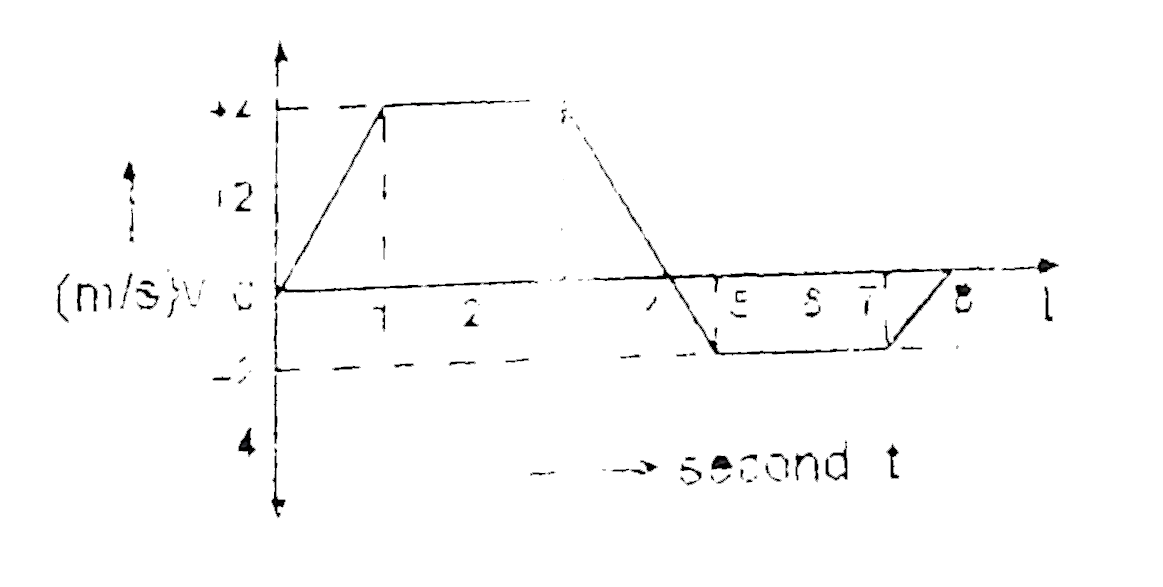
The distance travelled by the particle is :
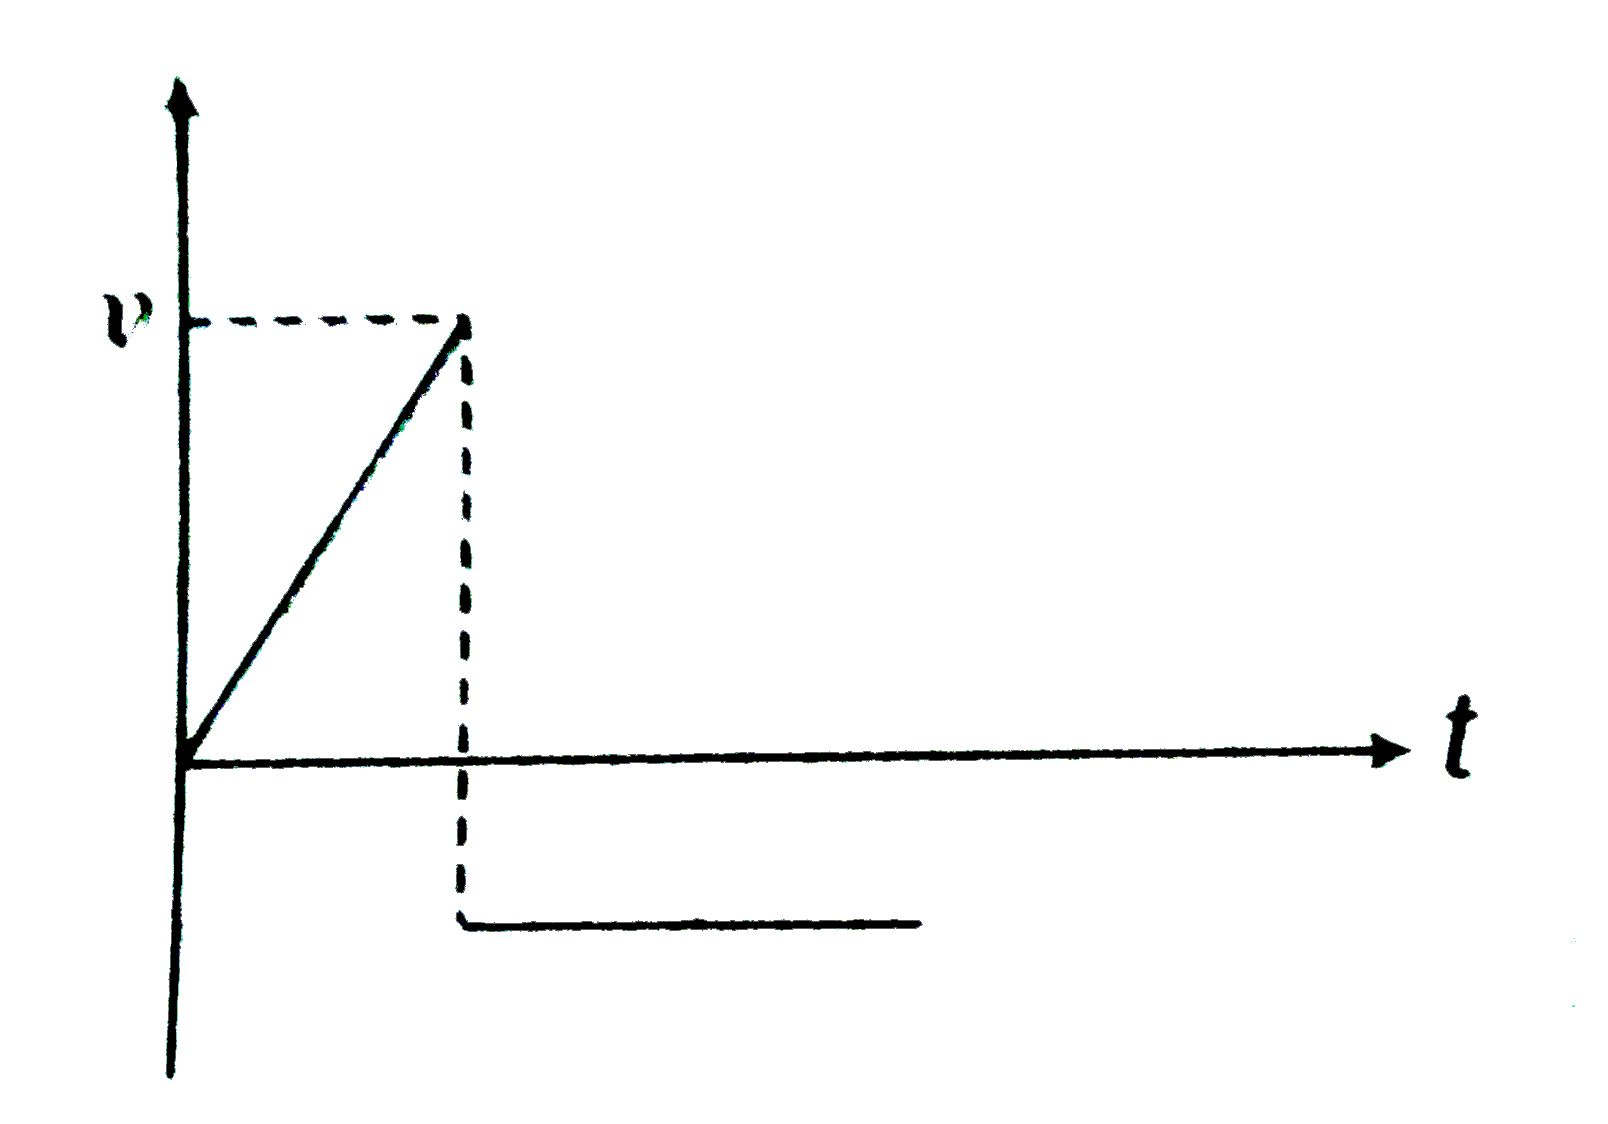
View SolutionThe velocity-time graph for a particle moving along X-axis is shown in the figure. The corresponding displacement-time graph is correctly shown by
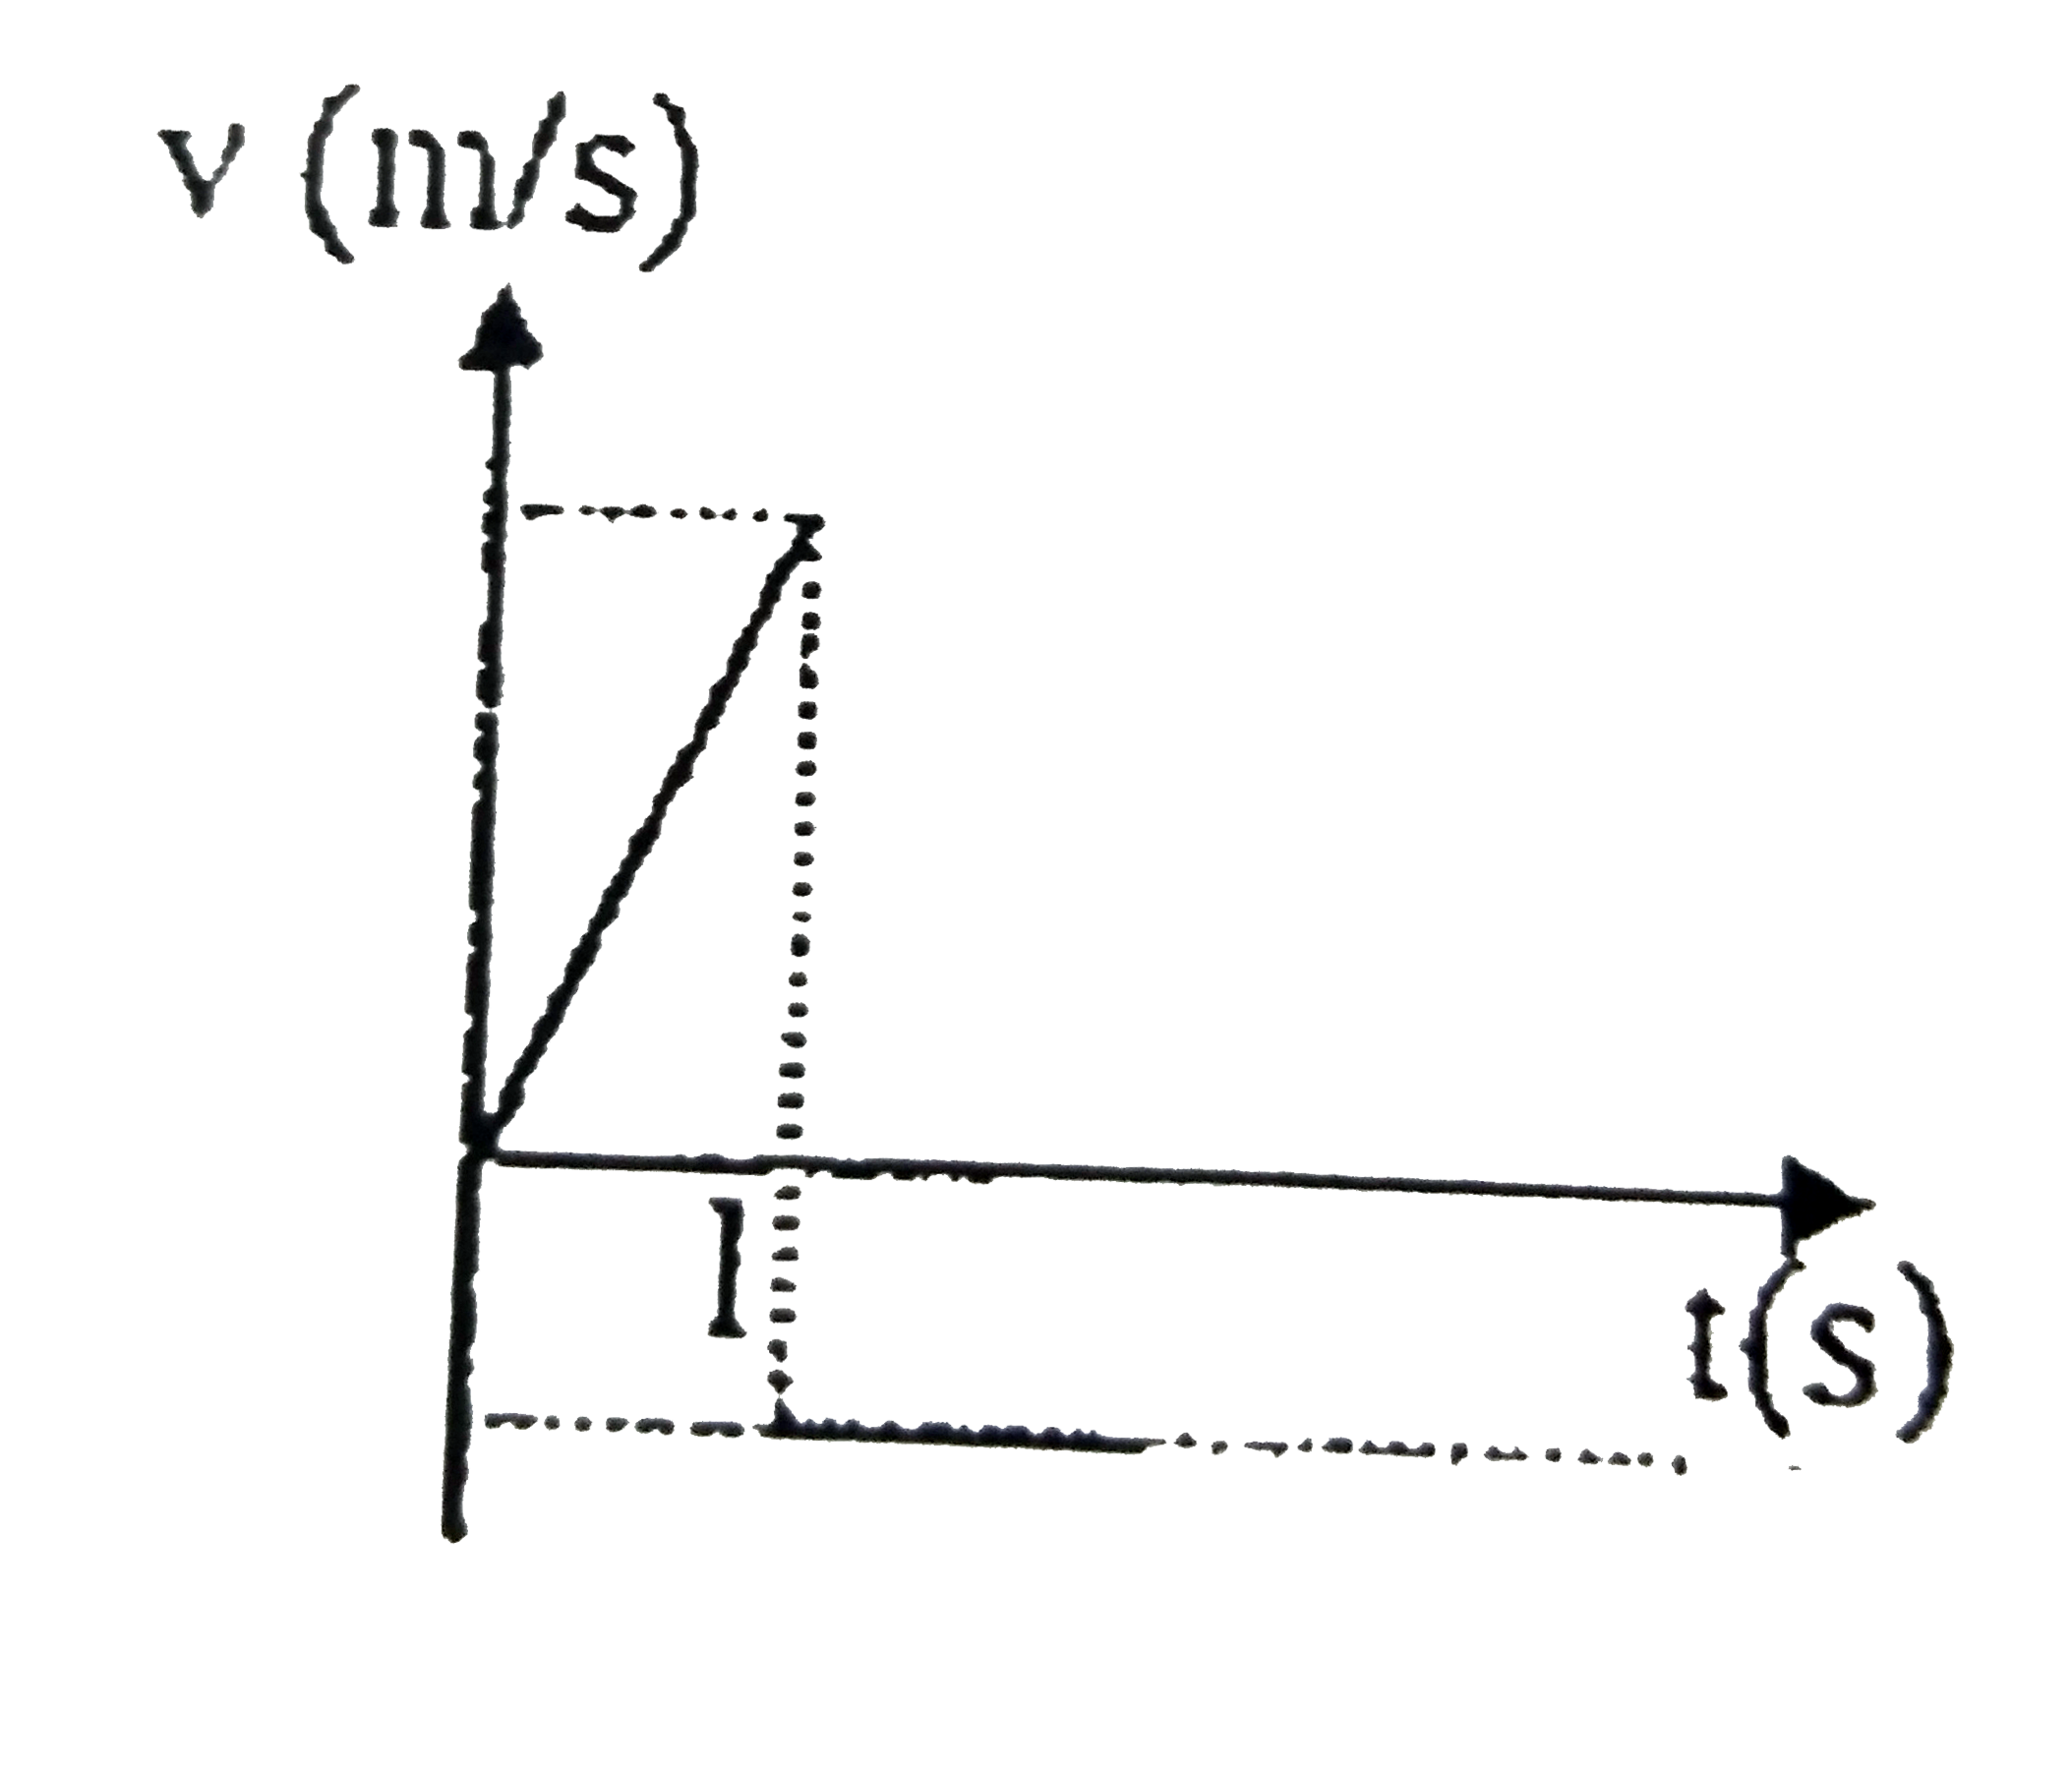
View SolutionThe velocity time graph for a particle moving along x-axis is shown in the figure. The corresponding displacement time graph is correctly shown by
View SolutionThe distance travelled by a body in different time intervals is tabulated as follows . Draw the distance time graphs.
View SolutionTotal distance between A and B is d kms . If the distance travelled along the stream is three time of the total distance and the distance travelled against the stream is two times of the total distance . If the time taken to cover the distance along the stream is 10% less then the time taken to cover the distance against the stream .if a person cover a distance of 21 km in 1 hr 24 min along the stream , then find the rate of current ?
View SolutionA graph is drawn with a force along y-axis and time along x-axis. The area under the graph represent–
View SolutionThe following table gives the distances travelled by a car at various time- intervals . Study the table and draw a linear graph for the same.

From your graph, answer the questions given below:
(i) How much distance did the car cover during the period from 7.30 a.m. to 8 a.m.
(ii) What was the time when the car had covered a distance of 100km, since its start ?
(iii) How much distance had the car covered by 8.30 a.m. ?
View Solutionएक कार द्वारा चली गईं दूरी तथा इस दूरी को तय करने में लगा समय सारणी में दिए गए हैं। इससे दूरी-समय ग्राफ खींचिए।

View Solutionएक रेलगाड़ी द्वारा तय की गई दूरी तथा इस दूरी को तय करने में लगा समय दिया गया है । इन आँकड़ों के आधार पर दूरी-समय आलेख खींचिए |

View Solutionएक साइकिल द्वारा तय की गई दूरी तथा उसी दूरी को तय करने में लगा समय का आँकड़ा नीचे सारणी में दिया जाता है । इससे दूरी-समय आलेख खींचिए-

View SolutionThe distances travelled by a car at various time intervals are as follows : Draw a distance-time graph for the car.
View Solution
