Examine the following plots and predict whether in (i) P1<P2andT1>T2 , in (ii) T1=T2<T3, in (iii) V1>V2,in(iv)P1>P2orP2>P1
_E01_267_Q01.png) Solution in Gujrati
Solution in Gujrati
The correct Answer is:(i)P1<P2,T1<T2 (ii) T1=T2<T3 (iii) V1<V2(iv)P1>P2
(i) P1V1=nRT1andP2V2=nRT2
∵P2V2>P1V1
⇒nRT2>nRT1⇒T2>T1 For same volume, P1V=nRT1
∵T1<T2 & P2V=nRT2
⇒P1<P2
_E01_267_S01.png)
(ii) P2V2=P1V1=2PV=P2V⇒T1=T2 For state 3:
Let V3=3V/2
P3=3P/2 then P3V3=3P23V2=94PV
∴T3>T2 & T3<T1
_E01_267_S02.png)
(iii) P=mT+C⇒P−CT=m
⇒(P1−CT1)=(P2−CT2) From ideal gas equation P1V1T1=P2V2T2⇒P1V1P2V2=T1T2=(P1−CP2−C)
⇒V1V2=(1−CP1/(1−CP2)<1⇒V1<V2
(iv) V=mT−C,V1+CT1=V2+CT2thenP1V1=nRT1
P2V2=nRT2⇒P1V1P2V2=nRT1nRT2
⇒P1P2=T1T2×V2V1=(V1+CV1)(V2V2+C)
P1P2=(1+CV1)11+CV2>1∴P1>P2
_E01_267_S03.png)
_E01_267_S04.png)
Topper's Solved these Questions
- GEOMETRICAL OPTICSBOOK - ALLEN CHAPTER - GEOMETRICAL OPTICSEXERCISE - EXERCISE - 04 (B)
15 Videos
- GEOMETRICAL OPTICSBOOK - ALLEN CHAPTER - GEOMETRICAL OPTICSEXERCISE - EXERCISE - 05 (A)
73 Videos
- GEOMETRICAL OPTICSBOOK - ALLEN CHAPTER - GEOMETRICAL OPTICSEXERCISE - Comprehension Based Questions
66 Videos
- CURRENT ELECTRICITYBOOK - ALLEN CHAPTER - CURRENT ELECTRICITYEXERCISE - EX.II
66 Videos
- GRAVITATIONBOOK - ALLEN CHAPTER - GRAVITATIONEXERCISE - EXERCISE 4
9 Videos
Similar Questions
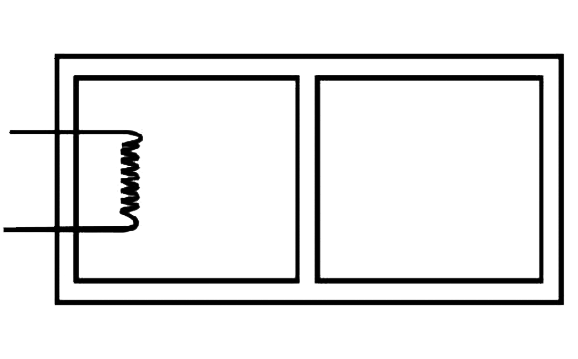
The rectangular box shown in Fig has partition which can slide without friction along the length of the box. Initially each of the two chambers of the box has one mole of a mono-atomic ideal gas (λ=5/3) at a pressure P0, volume V0 and temperature T0. The chamber on the left is slowly heated by an electric heater. The walls of the box and the lead wires of the heater is negligible. The gas in the left chamber expands pushing the partition until the final pressure in both chambers becomes 243P0/32. Determine (i) the final temperature of the gas in each chamber and (ii) the work done by the gas in the right chamber.
View SolutionAn aluminium sphere of 20cm diameter is heated from 0∘C to 100∘C. Its volume changes by (given that the coefficient of linear expanison for aluminium (αAl=23×10−6/0C)
View SolutionA certain amount of ice is supplied heat at a constant rate for 7 min. For the first one minute the temperature rises uniformly with time. Then it remains constant for the next 4 min and again the temperature rises at uniform rate for the last 2 min. Given Sice=0.5cal/g∘C,Lf=80cal/g.
The initial temperature of ice is
View SolutionIn the Bohr's model of hy drogen atom, the electron moves around the nucleus in a circular orbit of radius 5×10⁻¹¹m. Its time period is 1.5×10⁻¹⁶s. The current associated with the electron motion is:-
View SolutionAssertion : The difference in the value of acceleration due to gravity at pole and equator is proportional to square of angular velocity of earth.
Reason : the value of acceleration due to gravity is minimum at the equator and maximum at the pole.
View SolutionFor an ideal gas, an illustratio of three different paths A(B+C) and (D+E) from an initial state P1,V1,T1 to a final state P2,V2,T1 is shown in the given figure.
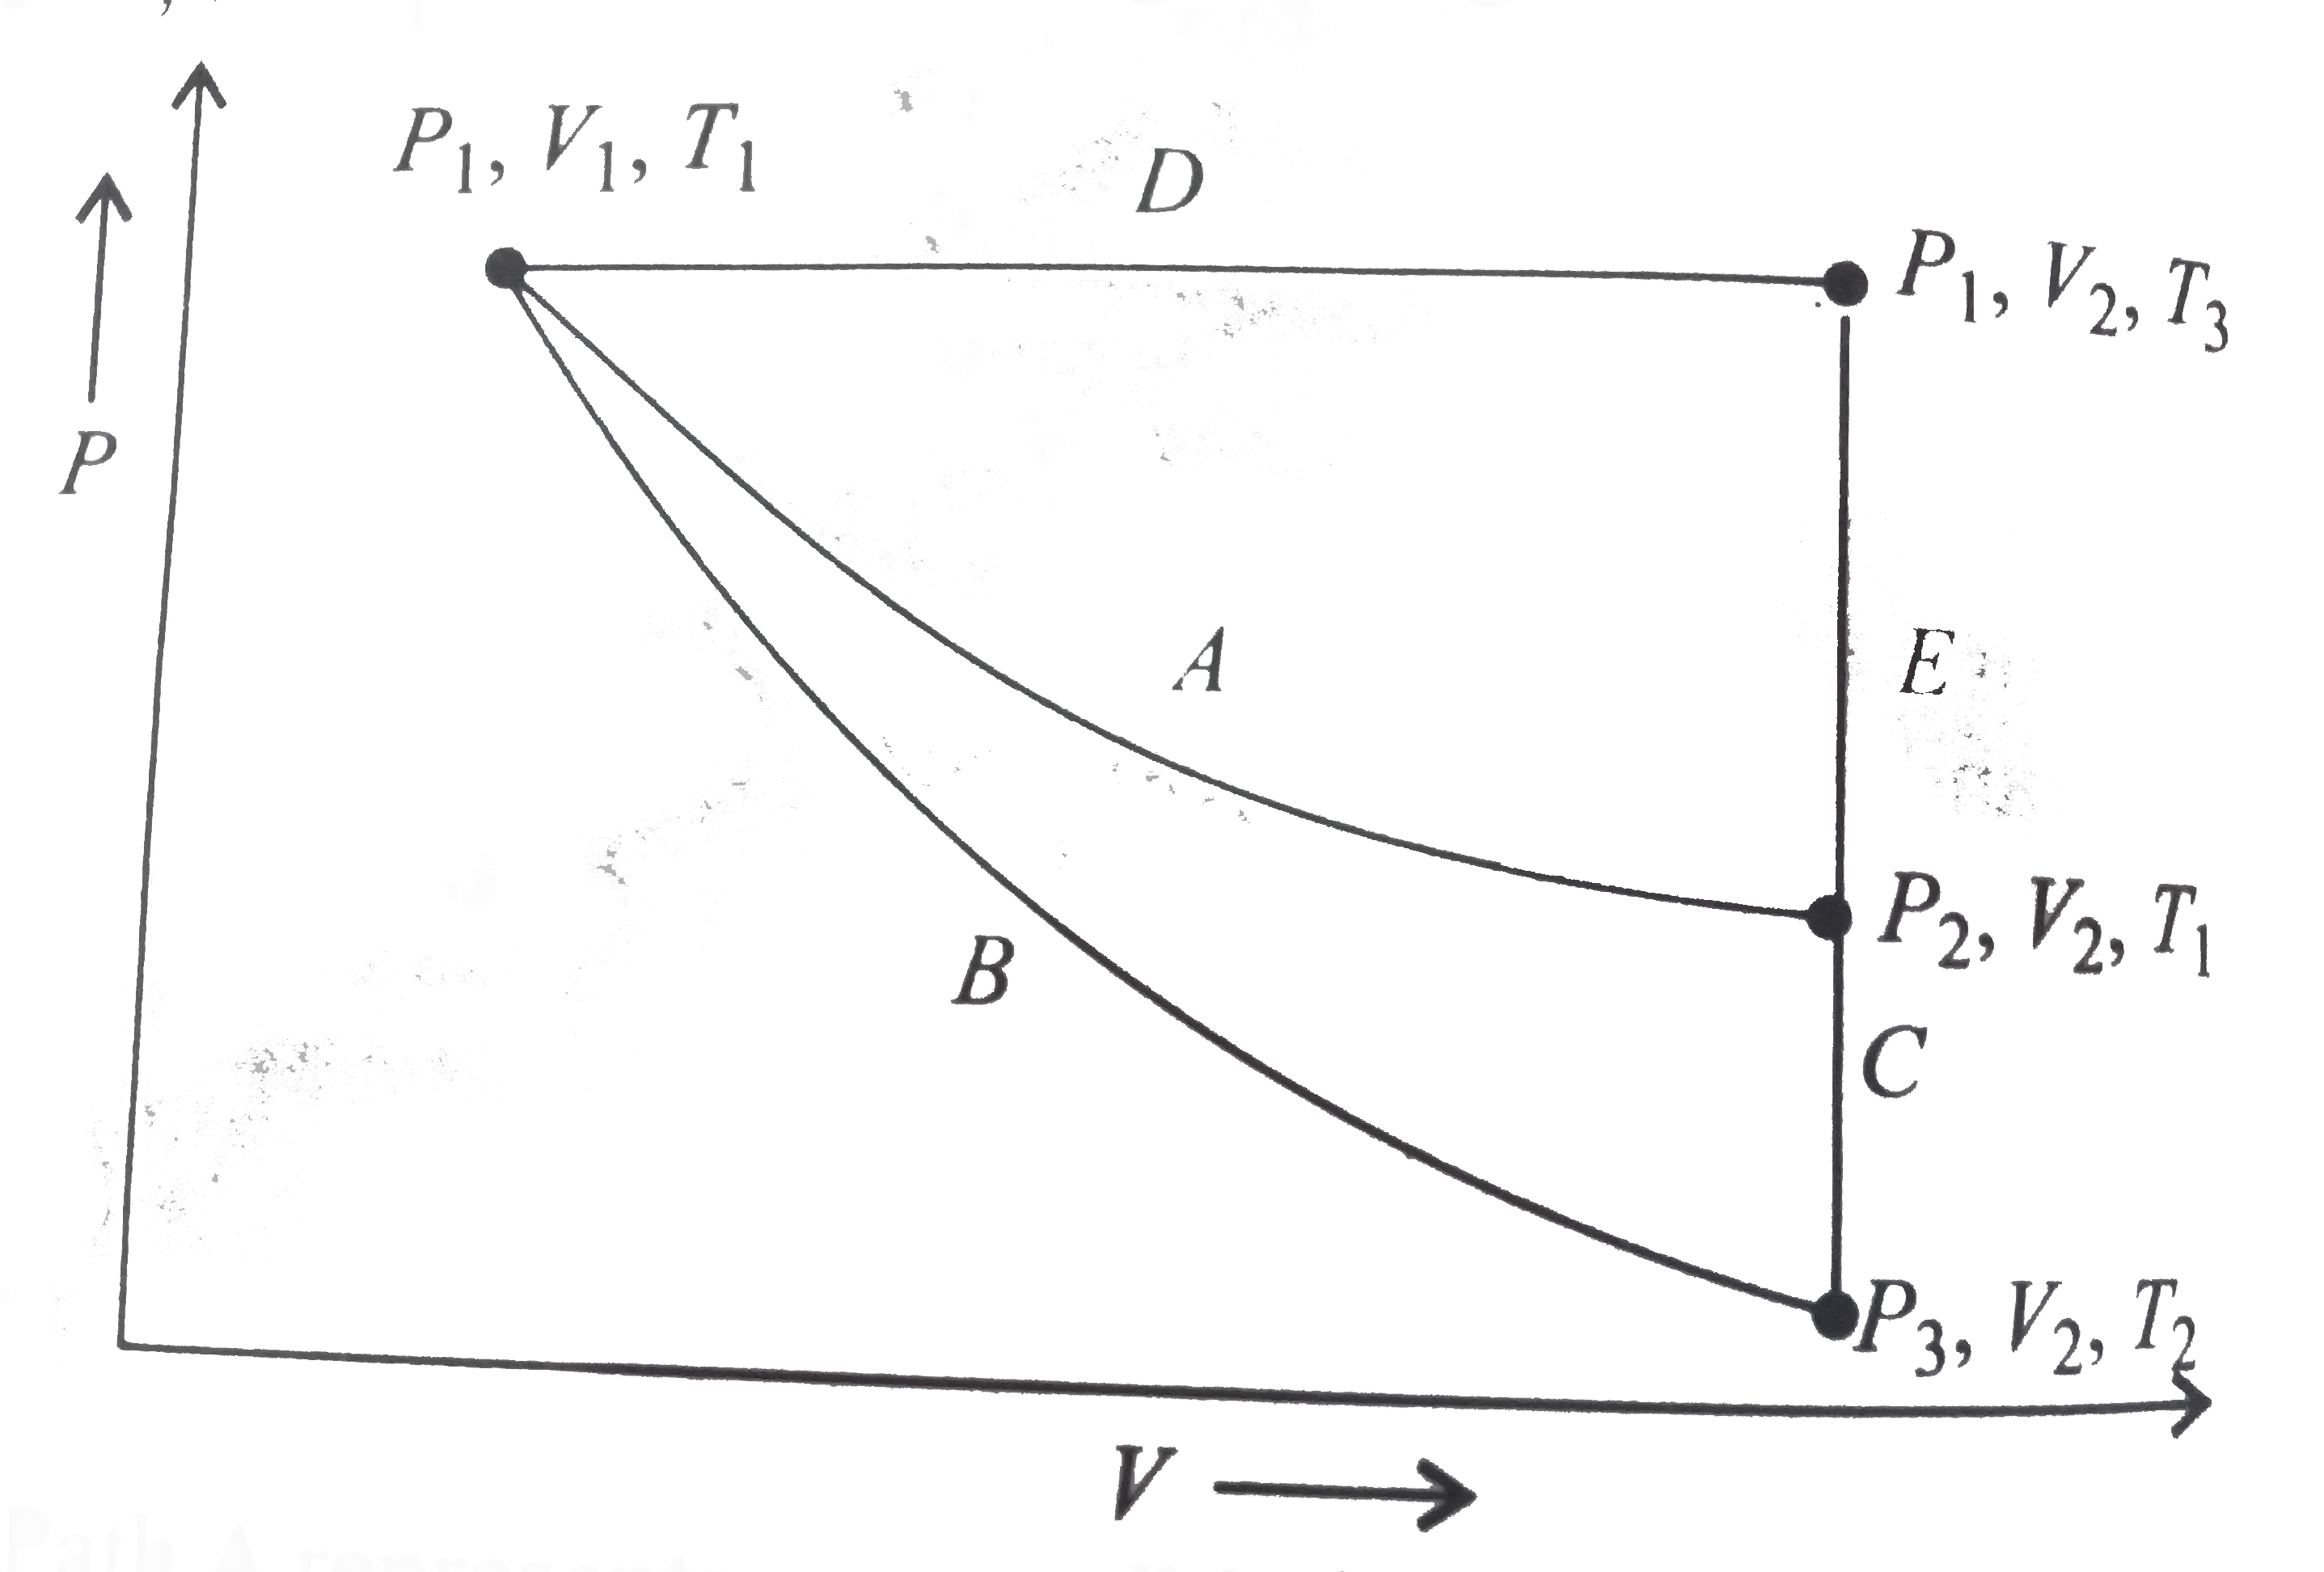
Path Arepresents a reversible isothermal expansion form P1,V1 to P2,V2, Path (B+C) represents a reversible adiabatic expansion (B) from P1,V1,T1→P3,V2,T2 followed by reversible heating the gas at constant volume (C)from P3,V2,T2 to P2,V2,T1. Path (D+E) represents a reversible expansion at constant pressure P1(D) from P1,V1,T1 to P1,V2,T3 followed by a reversible cooling at constant volume V2(E) from P1,V2,T3→P2,V2,T1.
What is qrev, for path (A)?
View SolutionFor an ideal gas, an illustratio of three different paths A(B+C) and (D+E) from an initial state P_(1), V_(1), T_(1) to a final state P_(2), V_(2),T_(1) is shown in the given figure. Path A represents a reversible isothermal expansion form P_(1),V_(1) to P_(2),V_(2) , Path (B+C) represents a reversible adiabatic expansion (B) from P_(1),V_(1),T_(1)to P_(3),V_(2),T_(2) followed by reversible heating the gas at constant volume (C) from P_(3),V_(2),T_(2) to P_(2),V_(2),T_(1) . Path (D+E) represents a reversible expansion at constant pressure P_(1)(D) from P_(1),V_(1),T_(1) to P_(1),V_(2),T_(3) followed by a reversible cooling at constant volume V_(2)(E) from P_(1),V_(2),T_(3) to P_(2),V_(2),T_(1) . What is q_(rev) , for path (B +C) ?
View SolutionFor an ideal gas, an illustratio of three different paths A(B+C) and (D+E) from an initial state P1,V1,T1 to a final state P2,V2,T1 is shown in the given figure.
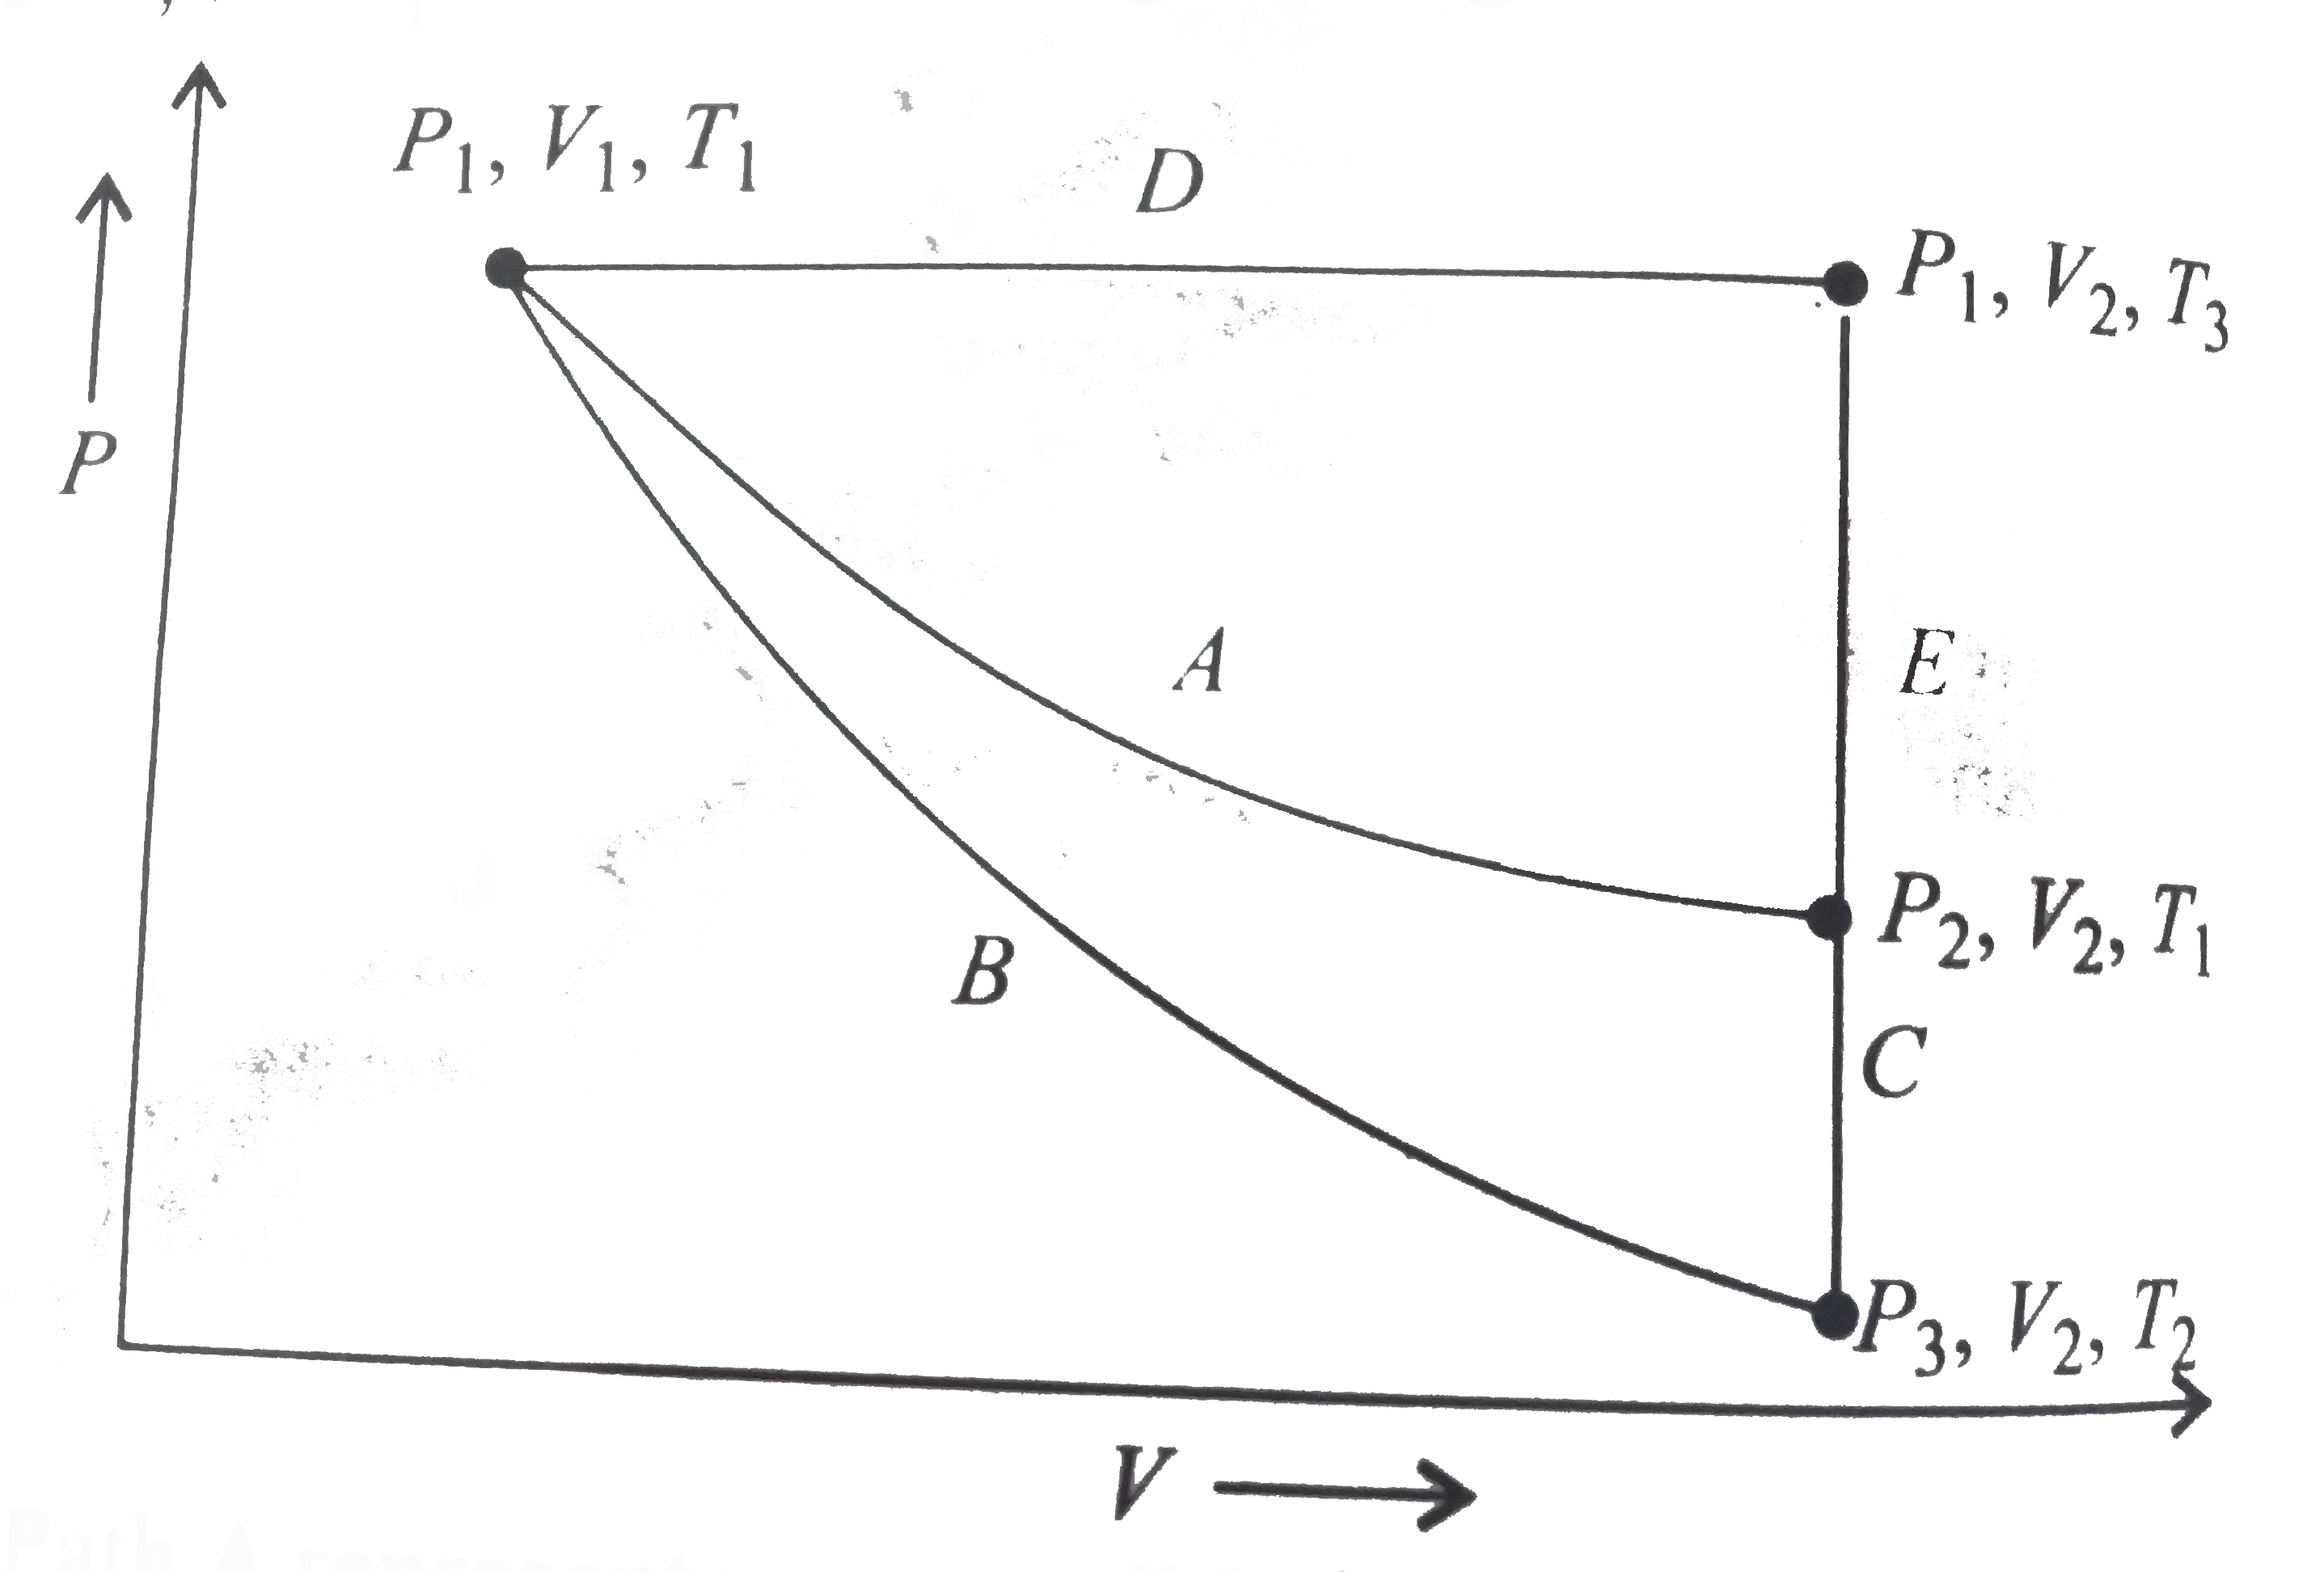
Path Arepresents a reversible isothermal expansion form P1,V1 to P2,V2, Path (B+C) represents a reversible adiabatic expansion (B) from P1,V1,T1→P3,V2,T2 followed by reversible heating the gas at constant volume (C)from P3,V2,T2 to P2,V2,T1. Path (D+E) represents a reversible expansion at constant pressure P1(D) from P1,V1,T1 to P1,V2,T3 followed by a reversible cooling at constant volume V2(E) from P1,V2,T3→P2,V2,T1.
What is ΔS for path A?
View SolutionFor an ideal gas, an illustratio of three different paths A(B+C) and (D+E) from an initial state P1,V1,T1 to a final state P2,V2,T1 is shown in the given figure.
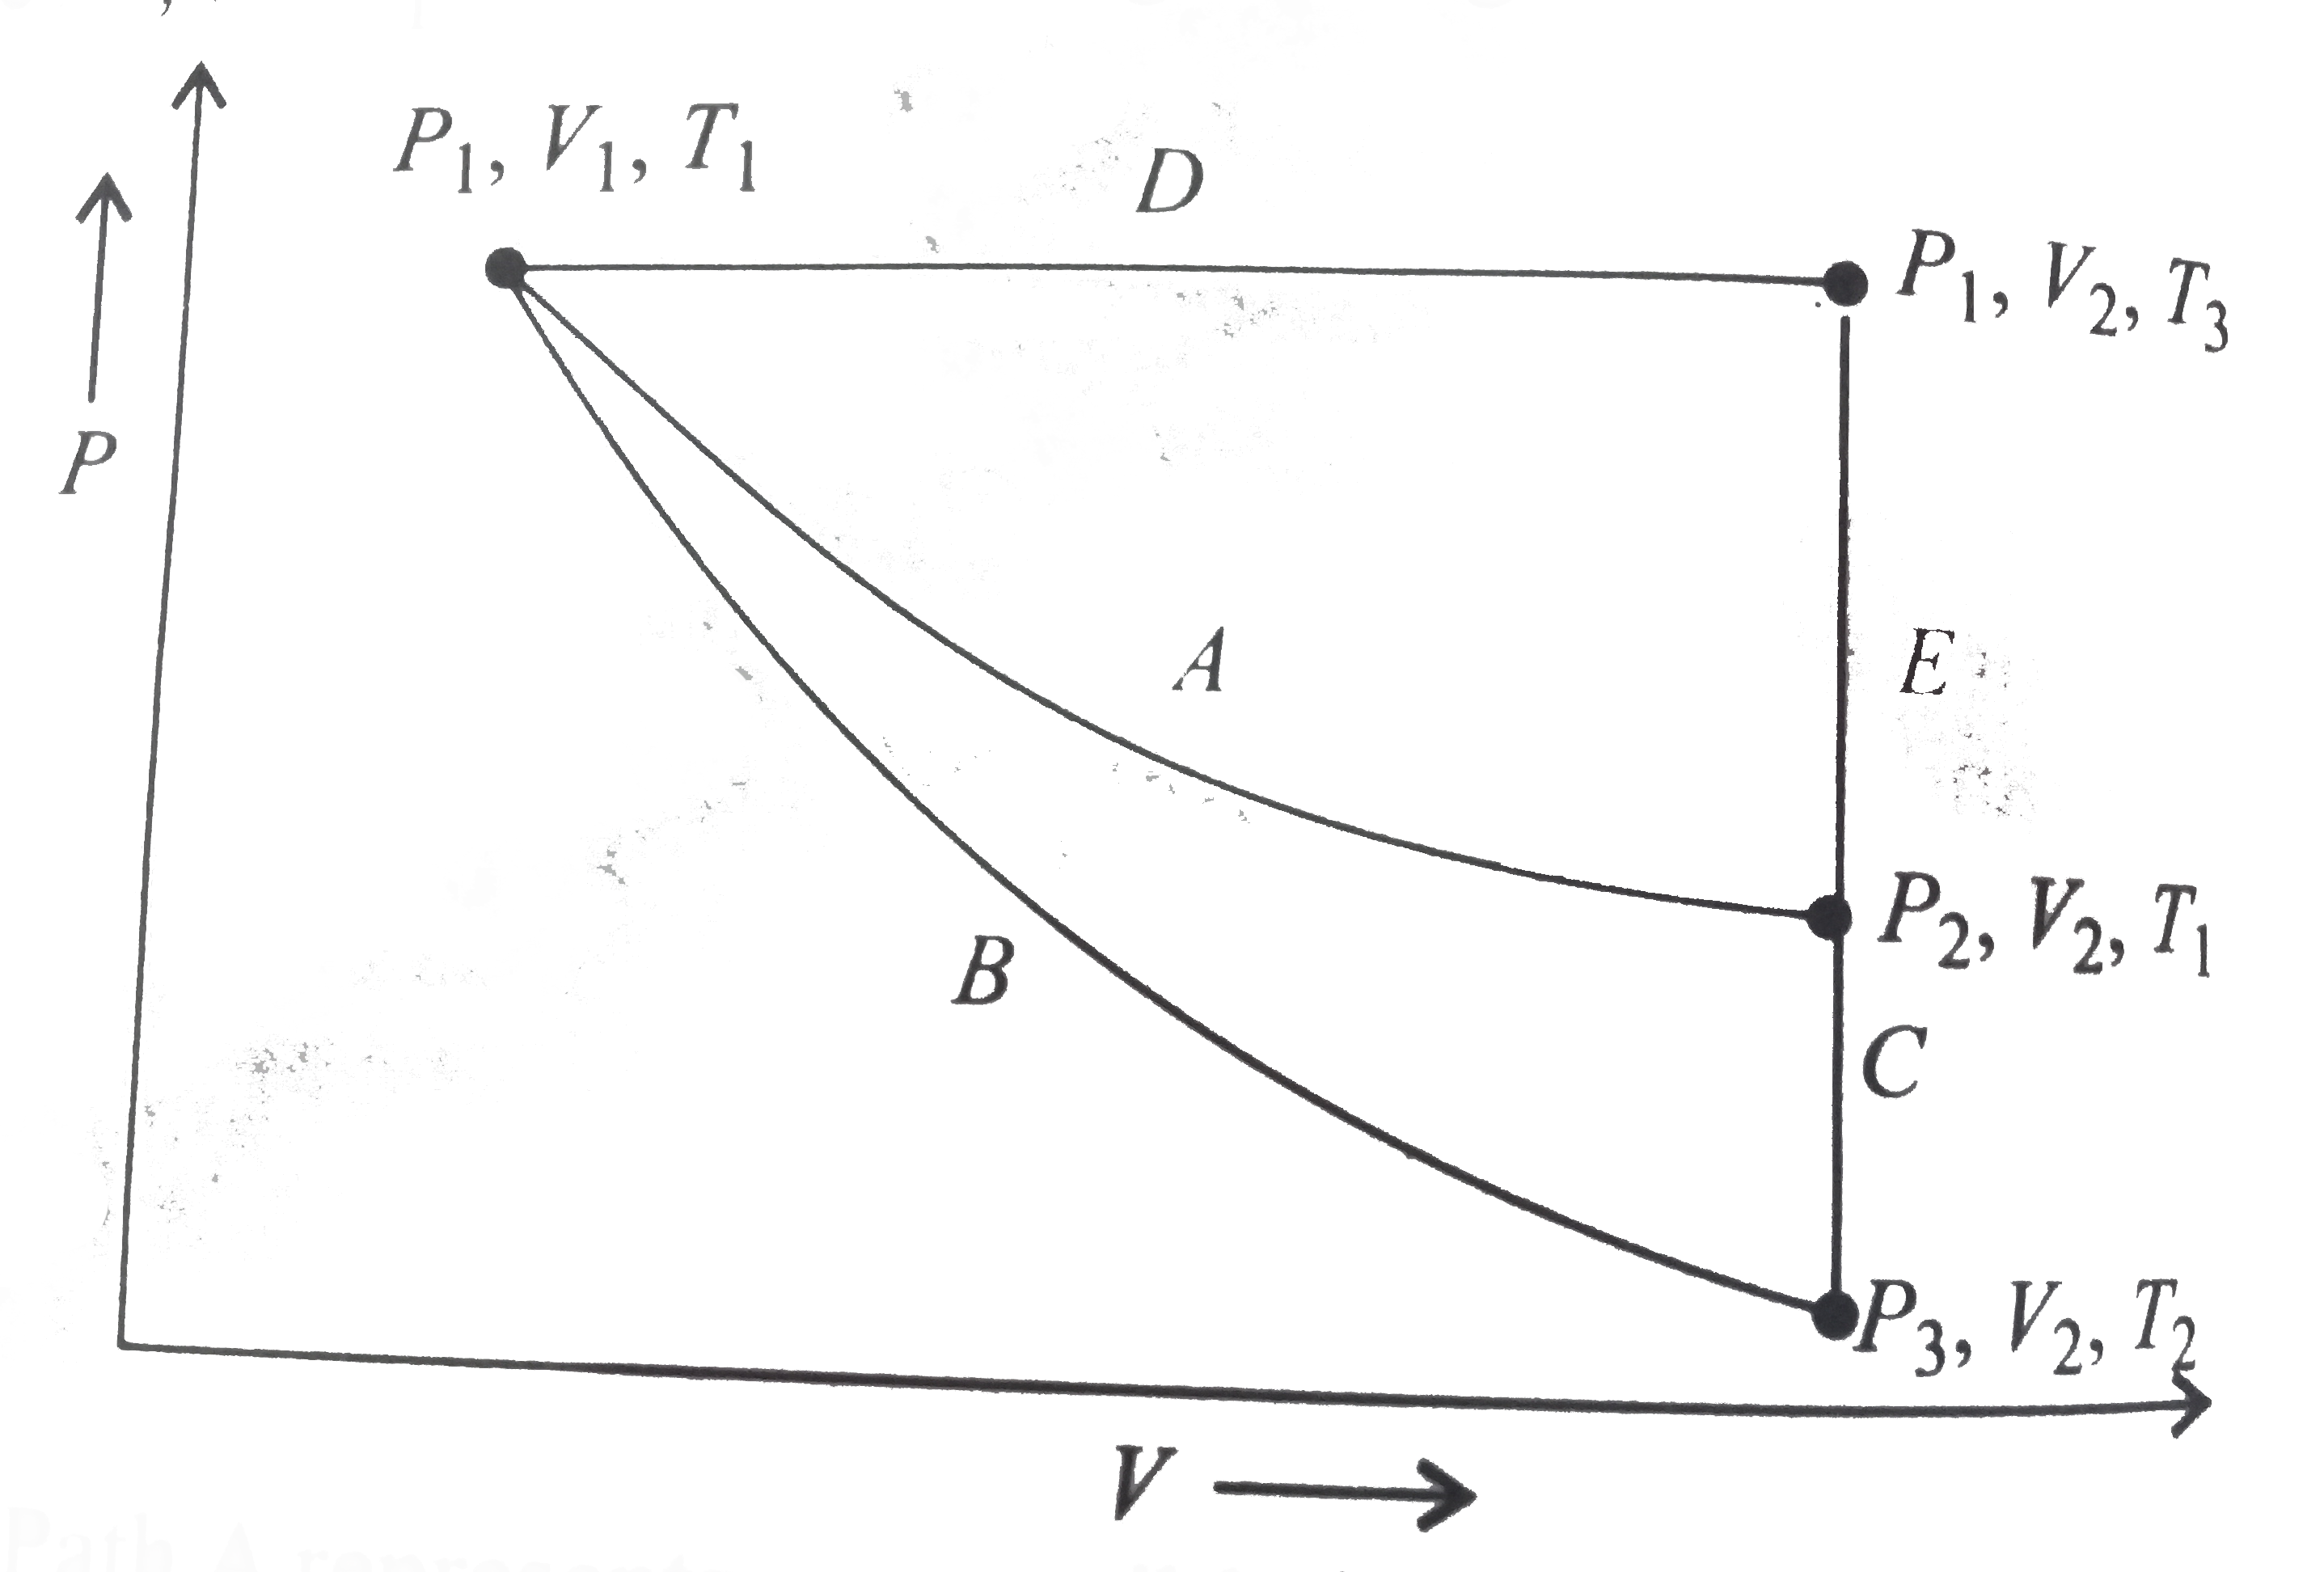
Path Arepresents a reversible isothermal expansion form P1,V1 to P2,V2, Path (B+C) represents a reversible adiabatic expansion (B) from P1,V1,T1→P3,V2,T2 followed by reversible heating the gas at constant volume (C)from P3,V2,T2 to P2,V2,T1. Path (D+E) represents a reversible expansion at constant pressure P1(D) from P1,V1,T1 to P1,V2,T3 followed by a reversible cooling at constant volume V2(E) from P1,V2,T3→P2,V2,T1.
What is qrev, for path (D+E)?
View SolutionFor an ideal gas, an illustratio of three different paths A(B+C) and (D+E) from an initial state P_(1), V_(1), T_(1) to a final state P_(2), V_(2),T_(1) is shown in the given figure. Path A represents a reversible isothermal expansion form P_(1),V_(1) to P_(2),V_(2) , Path (B+C) represents a reversible adiabatic expansion (B) from P_(1),V_(1),T_(1)to P_(3),V_(2),T_(2) followed by reversible heating the gas at constant volume (C) from P_(3),V_(2),T_(2) to P_(2),V_(2),T_(1) . Path (D+E) represents a reversible expansion at constant pressure P_(1)(D) from P_(1),V_(1),T_(1) to P_(1),V_(2),T_(3) followed by a reversible cooling at constant volume V_(2)(E) from P_(1),V_(2),T_(3) to P_(2),V_(2),T_(1) . What is DeltaS for path (D +E) ?
View SolutionExplain whether (a) T_(2) gt T_(1) , (b) P_(2) gt P_(1) and (c ) V_(2) gt V_(1) or otherwise in Fig., which represent in isothermal, isobaric, and isochoric processes for the same mass of an ideal gas, respedtively.
View SolutionAn ideal gasa undergoes through folowing cyclic procees. 1-2 : Reversible adialbatic comparession from P_(1)V_(1)T_(1)"to"P_(2)V_(2)T_(2) 2-3 : Reversible isochoric heating from P_(2)V_(2)T_(2)" to " P_(3)V_(3)T_(3) 3-4 Reversible adialbatic expansion from P_(3)V_(3)T_(3)" to " P_(4)V_(4)T_(4) 4-1 Reversible isochoric cooling from P_(4)V_(4)T_(4)" to " P_(1)V_(1)T_(1) Eefficiencyof the cycle is :
View SolutionFor an ideal monoatomic gas, an illustration of three different paths A,(B+C) and (D+E) from an initial state P_(1),V_(1),T_(1) to a final state P_(2),V_(2),T_(1) is shown in the given figure . Path A represents a reversible isothermal from P_(1)V_(1)" to "P_(2),V_(2) , path (B+C) represent a reversible adiabatic expansion (B) from P_(1),V_(1),T_(1)" to " P_(3),V_(2),T_(2) followed by reversible heating of the gas at constant volume (C) from P_(3),V_(2),T_(2) " to " P_(2),V_(2),T_(1) . Path (D+E) represents a reversible expansion at constant pressure P_(1)(D) from P_(1),V_(1),T_(1) " to "P_(1),V_(2),T_(3) followed by a reversible cooling at constant volume V_(2)(E) form P_(1),V_(2),T_(3) " to "P_(2),V_(2),T_(1) What is q_("rev") for path (A)?
View SolutionFor an ideal monoatomic gas, an illustration of three different paths A,(B+C) and (D+E) from an initial state P1,V1,T1 to a final state P2,V2,T1 is shown in the given figure .
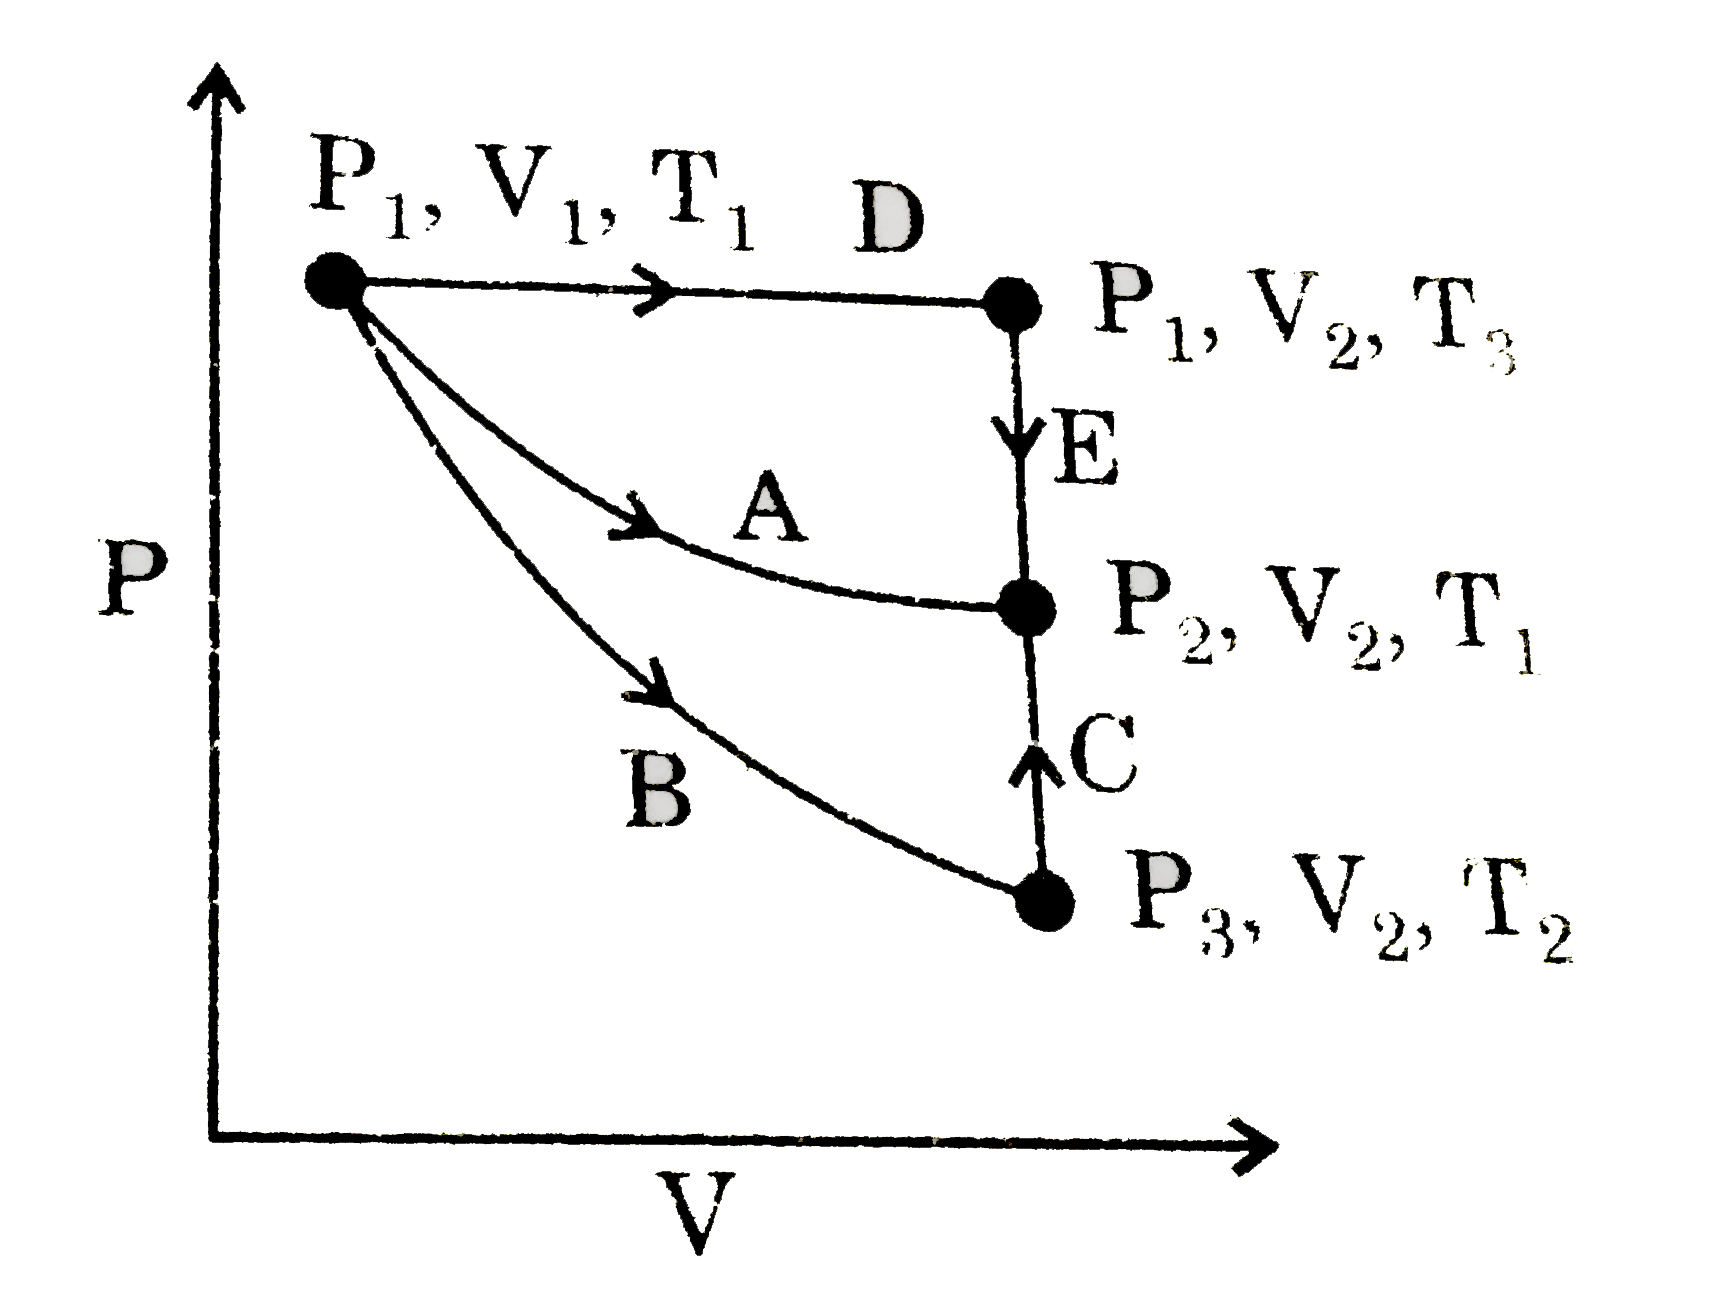
Path A represents a reversible isothermal from P1V1 to P2,V2, path (B+C) represent a reversible adiabatic expansion (B) from P1,V1,T1 to P3,V2,T2 followed by reversible heating of the gas at constant volume (C) from P3,V2,T2 to P2,V2,T1. Path (D+E) represents a reversible expansion at constant pressure P1(D) from P1,V1,T1 to P1,V2,T3 followed by a reversible cooling at constant volume V2(E) form P1,V2,T3 to P2,V2,T1
What is ΔS for (D+E)?
View SolutionEstablish gas equation, (P_(1)V_(1))/(T_(1))=(P_(2)V_(2))/(T_(2)) .
View SolutionA system Xundergoes following changes
XP1V1T1→WP2V2T1→ZP3V2T2→XP1V1T1
The overall process may be called as
View Solution
