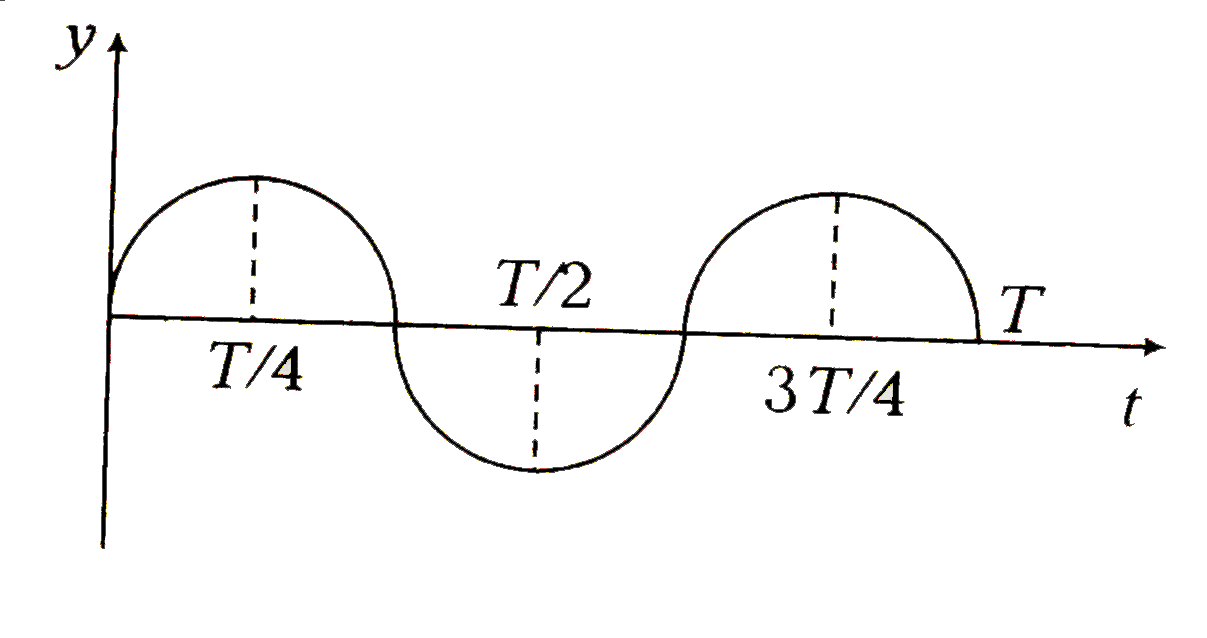
The graph shows the variation of displacement of a particle executing S.H.M with time. We inference form this graph that :-
_E01_037_Q01.png) Solution in Gujrati
Solution in Gujrati
(a)the force is zero at time 3T4
(b)the velocity is maximum at time T2
(c)the acceleration is maximum at time T
(d)the P.E. is equal to half of total energy at time T2
The correct Answer is:B
For (A) : at t=3T4, particle at extreme position
∵a=−ω2x∵F≠0
For (B) at t=T/2, particle at mean position
(t=T/2)
v=ωA
For (C) : at t=T, particle at mean position
⇒a=−ω2x=0
For (D) : at t=t/2, particle at mean position
(t=T/2)
so x=0⇒U=12kx2=0
Topper's Solved these Questions
- SIMPLE HARMONIC MOTIONBOOK - ALLEN CHAPTER - SIMPLE HARMONIC MOTIONEXERCISE - Exercise-02
19 Videos
- SIMPLE HARMONIC MOTIONBOOK - ALLEN CHAPTER - SIMPLE HARMONIC MOTIONEXERCISE - Exercise- 3 Match The Column
1 Videos
- SIMPLE HARMONIC MOTIONBOOK - ALLEN CHAPTER - SIMPLE HARMONIC MOTIONEXERCISE - SOME WORKED OUT EXAMPLES
29 Videos
- RACEBOOK - ALLEN CHAPTER - RACEEXERCISE - Basic Maths (Wave Motion & Dopplers Effect) (Stationary waves & doppler effect, beats)
25 Videos
- TEST PAPERBOOK - ALLEN CHAPTER - TEST PAPEREXERCISE - PHYSICS
4 Videos
Similar Questions
A mass M is performing linear simple harmonic motion. Then correct graph for acceleration a and corresponding linear velocity v is
View SolutionColumn-I gives different situtions in which bodes are floating in liquid. Column-II gives correspoding time periods of oscillation.
_E01_069_Q01.png)
A cube floating in liquid.
View SolutionA simple pendulum has time period 2s. The point of suspension is now moved upward accoding to relation y=(6t−3.75t2)m where t is in second and y is the vertical displacement in upward direction. The new time period of simple pendulum will be
View SolutionThe frequency of a radar is 780 MHz. After getting reflected from an approaching aeroplane, the apparent frequency is more than the actual frequency by 2.6 kHz. The aeroplane has a speed of
View SolutionChoose the correct statement:
View SolutionThe displacement time graph of a particle executing S.H.M. is as shown in the figure The corresponding force-time graph of the particle is
View SolutionFor a particle executing S.H.M. the displacement x is given by x= A cos omegat . Identify the graph which represents the variation of potential energy (P.E.) as a function of time
View SolutionGraph between velocity and displacement of a particle, executing S.H.M. is
View SolutionThe graph shows the variation of displacement of a particle executing SHM with time . We infer from this graph that

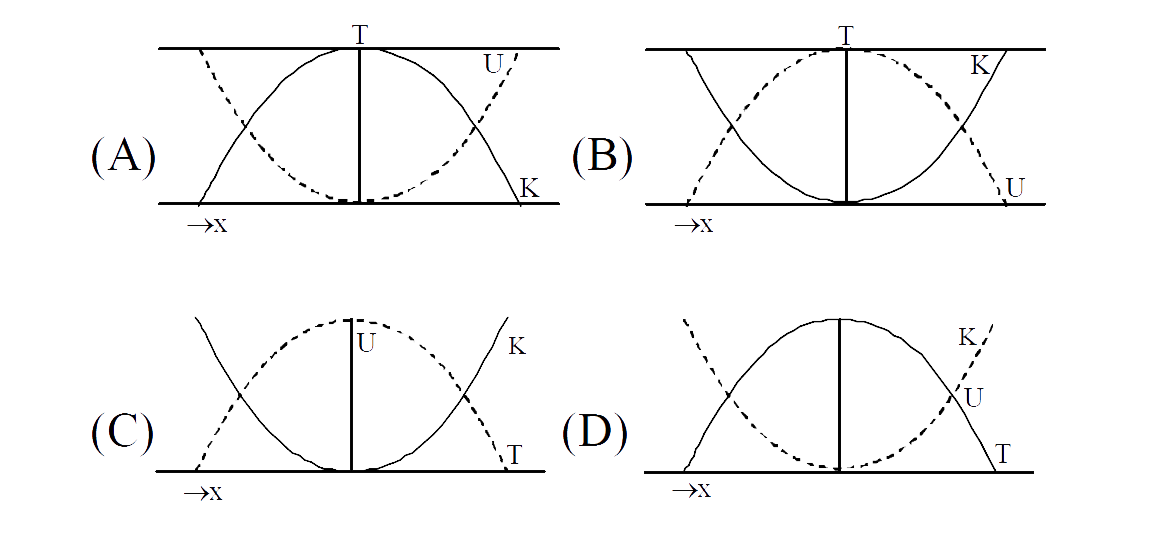
View SolutionA particle is executing S.H.M. along a straight line. The graph showing the variation of kinetic, potential and total energy K, U and T respectively with displacement is -

View SolutionA particle is executing S.H.M. along a straight line. The graph showing the variation of kinetic, potential and total energy K, U and T respectively with displacement is -
View SolutionThe graph plotted between force and displacement of a particle executing S.H.M is
View SolutionThe graph plotted between force and displacement of a particle executing S.H.M is
View SolutionThe graph plotted between force and displacement of a particle executing S.H.M is
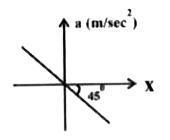
View SolutionAcceleration displacement graph of a particle executing S.H.M is as shown in given figure. The time period of its oscillation is (in sec)

View SolutionA particle executes SHM. Then the graph of velocity as a function of displacement is
View Solution
