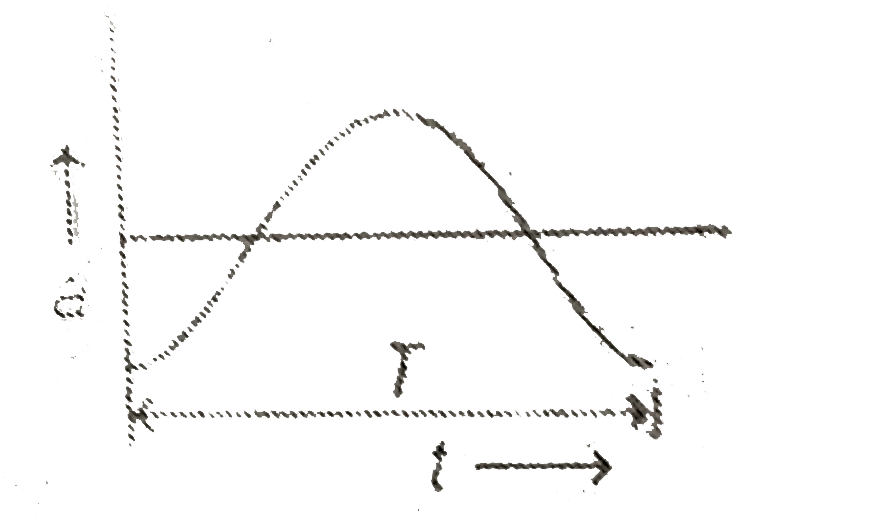
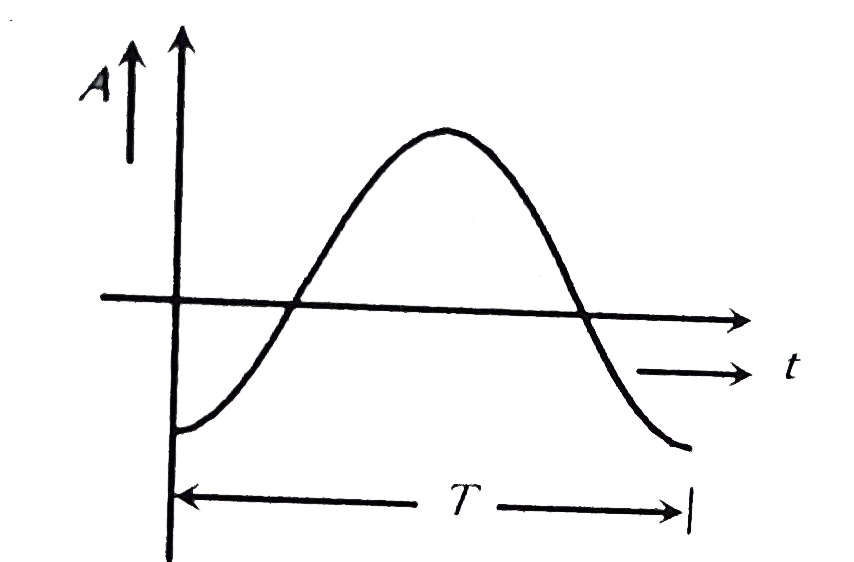
Acceleration versus time graph of a body in SHM is given by a curve shown below. T is the time period. Then corresponding graph between kinetic energy KE and time t is correctly represented by
 Solution in Gujrati
_E01_045_O01.png)
_E01_045_O02.png)
_E01_045_O03.png)
_E01_045_O04.png)
The correct Answer is:A
From the graph, equation of acceleration can be writtern as
a=−amaxcosωt
∴ velocity can be written is
v=−vmaxsinωt.
KE=12mv2=12mv2maxsin2ωt
Hence the graph is as shown in A
Topper's Solved these Questions
- SIMPLE HARMONIC MOTIONBOOK - ALLEN CHAPTER - SIMPLE HARMONIC MOTIONEXERCISE - Exercise-02
19 Videos
- SIMPLE HARMONIC MOTIONBOOK - ALLEN CHAPTER - SIMPLE HARMONIC MOTIONEXERCISE - Exercise- 3 Match The Column
1 Videos
- SIMPLE HARMONIC MOTIONBOOK - ALLEN CHAPTER - SIMPLE HARMONIC MOTIONEXERCISE - SOME WORKED OUT EXAMPLES
29 Videos
- RACEBOOK - ALLEN CHAPTER - RACEEXERCISE - Basic Maths (Wave Motion & Dopplers Effect) (Stationary waves & doppler effect, beats)
25 Videos
- TEST PAPERBOOK - ALLEN CHAPTER - TEST PAPEREXERCISE - PHYSICS
4 Videos
Similar Questions
A mass M is performing linear simple harmonic motion. Then correct graph for acceleration a and corresponding linear velocity v is
View SolutionColumn-I gives different situtions in which bodes are floating in liquid. Column-II gives correspoding time periods of oscillation.
_E01_069_Q01.png)
A cube floating in liquid.
View SolutionA simple pendulum has time period 2s. The point of suspension is now moved upward accoding to relation y=(6t−3.75t2)m where t is in second and y is the vertical displacement in upward direction. The new time period of simple pendulum will be
View SolutionThe frequency of a radar is 780 MHz. After getting reflected from an approaching aeroplane, the apparent frequency is more than the actual frequency by 2.6 kHz. The aeroplane has a speed of
View SolutionChoose the correct statement:
View Solutioni.The acceleration versus time graph of a partical SHM is shown in the figure . Plot the displacement versus time graph ii. The frection of oscillation is…….. iii. The displacement amplitude is ……… iv. At t = 0 , the velocity of the partical is ...... v. The kinetic energy of the partical is maximum at t = ....... and t = ...... vi. The potential energy is maximum at t = ....... : t = ..... ans t = .........
View SolutionThe graph below shws the velocity versus time graph for a body

Which of the following graph represents the corresponding acceleration v//s time graph?
View SolutionFor a particle moving on a straight lint the variation of acceleration with time is given by the graph as shown. Initially the particle was at rest. Then the corresponding kinetic energy of the particle versus time graph will be .
View SolutionAcceleration A and time period T of a body in S.H.M. is given by a curve shown below. Then corresponding graph, between kinetic energy (K.E.) and time t is correctly represented by

View SolutionThe kinetic energy (KE) versus time graph for a particle moving along a straight line is as shown in the figure. The force versus time graph for the particle may be

View SolutionAcceleration versus time graph of a body in SHM is given by a curve shown below. T is the time period. Then corresponding graph between kinetic energy KE and time t is correctly represented by
View SolutionAcceleration a versus time t graph of a body in SHM is given by a curve shown below. T is the time period Then corresponding graph between kinetic energy KE and time t is correctly represented by
View SolutionAcceleration versus time graph of a particle moving in a straight line is as shown in adjoining figure. If initially particle was at rest. Then corresponding kinetic energy versus time graph will be :

View SolutionThe graph in figure shows the velocity v versus time t for a body. Which of the graphs shown in figure represents the correesponding acceleration versus time graphs ?
View Solutionएक वस्तु सरल आवर्त गति कर रही है। इसकी गतिज ऊर्जा KE और समय t के मध्य सही ग्राफ होगा
View SolutionThe kinetic energy (KE) versus time graph for a particle moving along a straight line is as shown in the figure. The force versus time graph for the particle may be
View Solution
