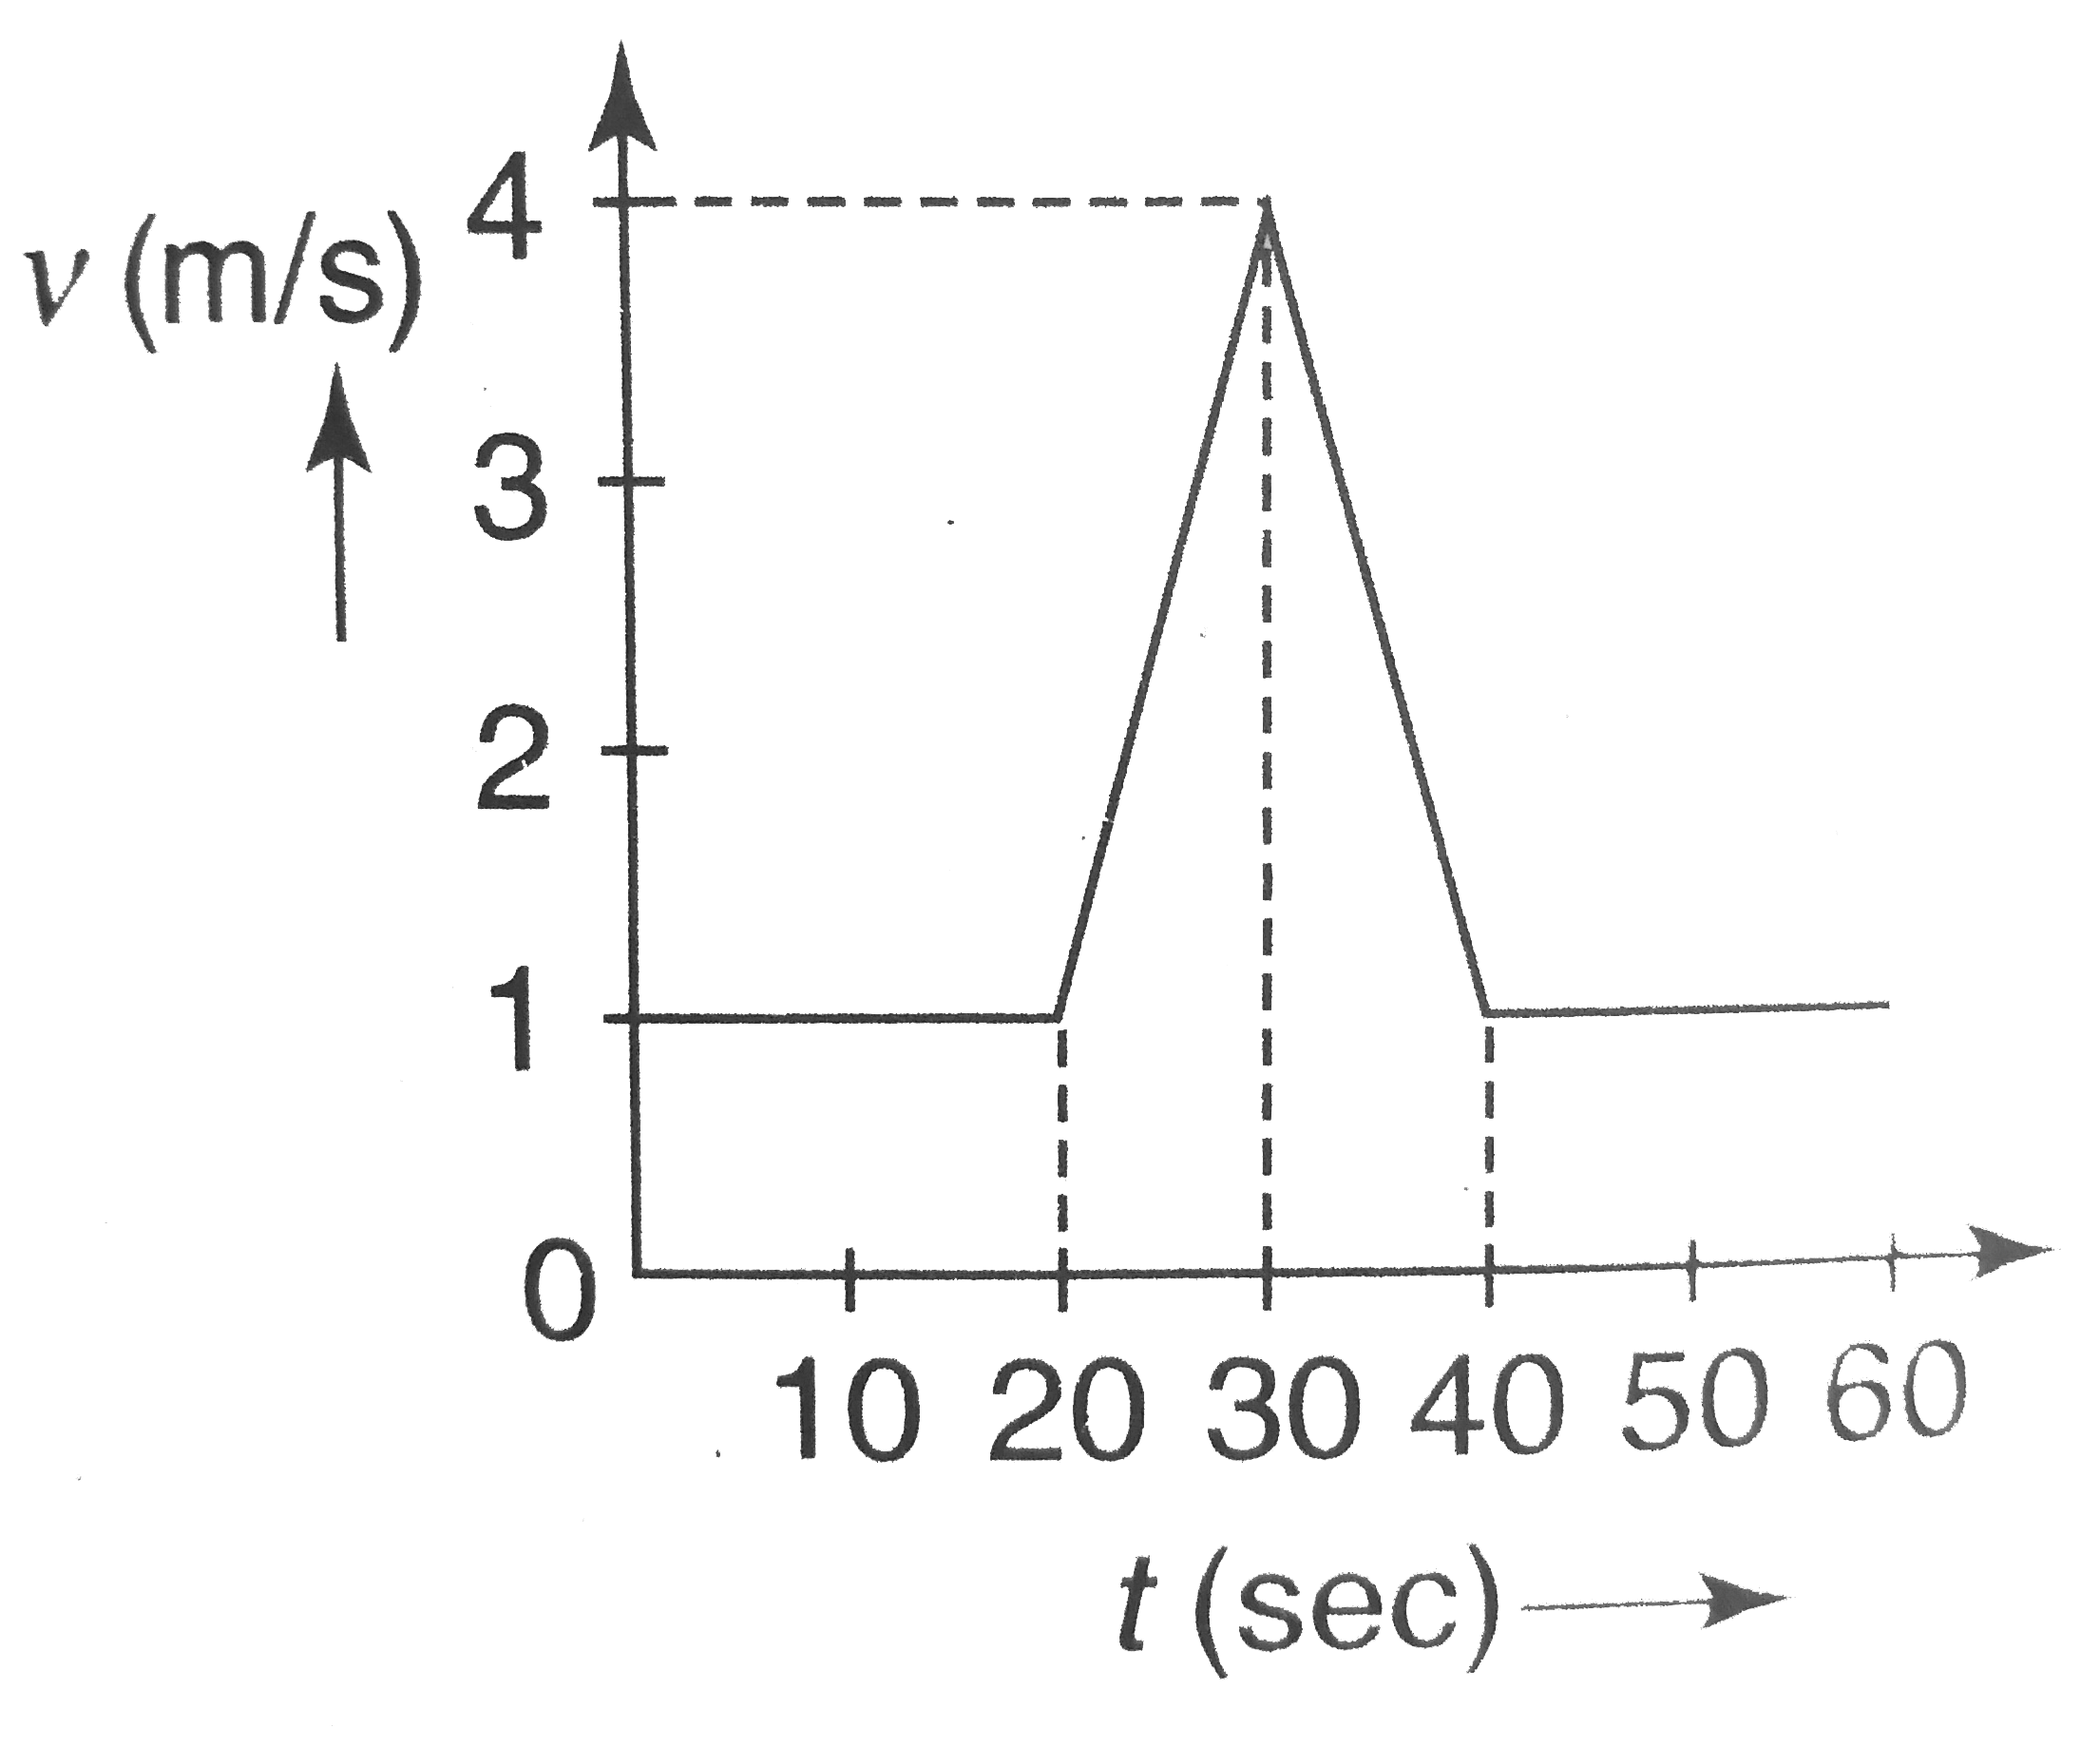
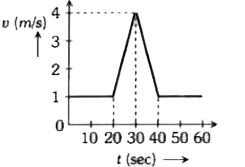
Velocity-time graph for a moving object is shown in the figure. Total displacement of the object during the time interval when there is non-zero acceleration and retardation is.
 Solution in Gujrati
The correct Answer is:(A)-r, (B)-q, (C)-r (D)-p
Rθ=vt,θ=4×11=4 radius
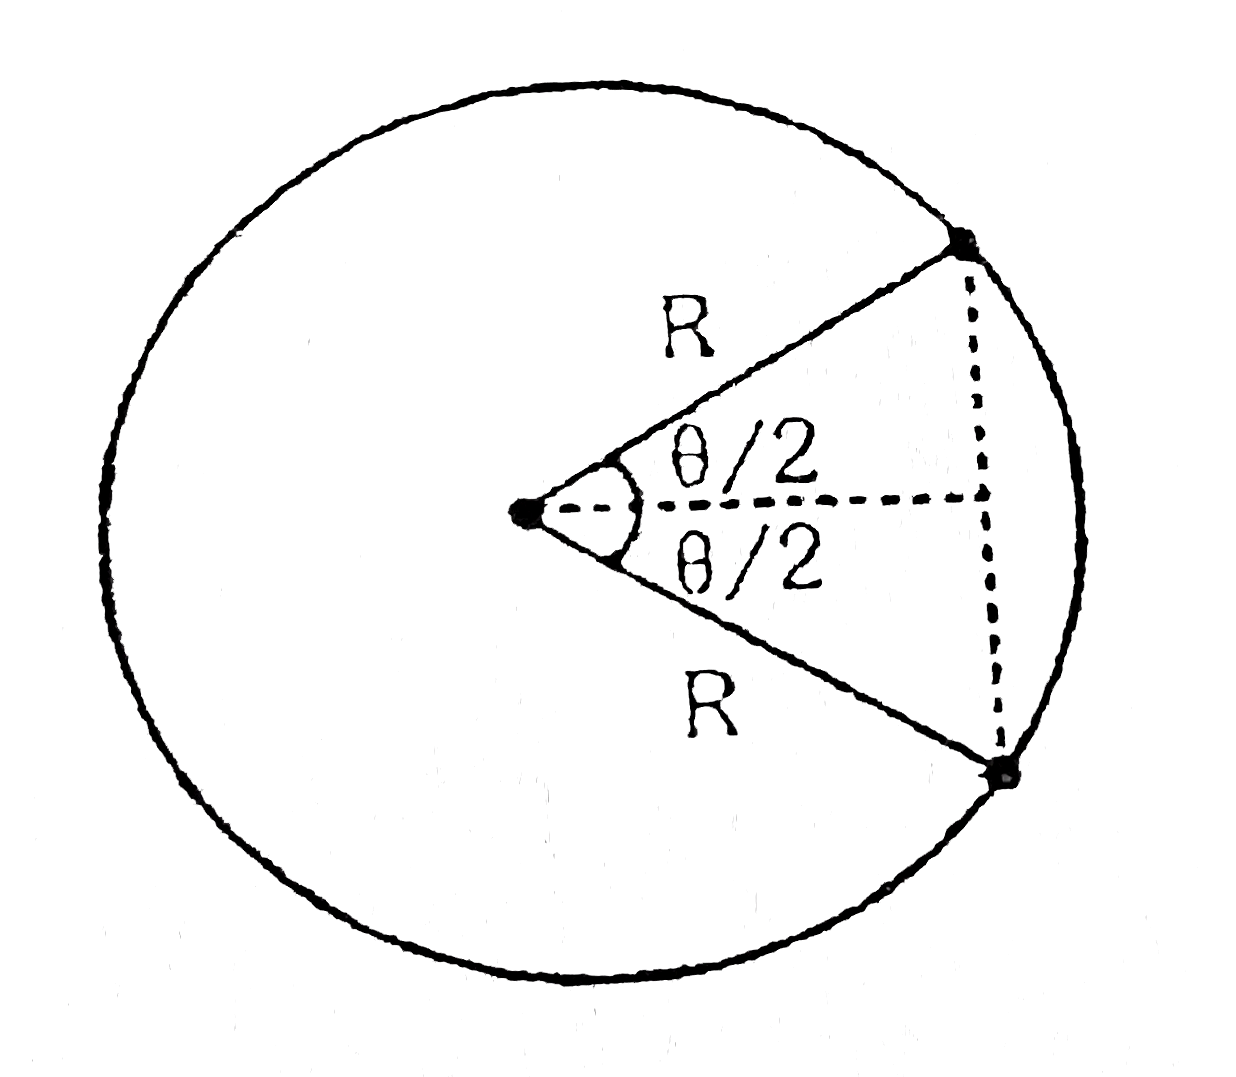
∴ Displacement =2Rsinθ/2=2sin2
Distance =vt=4m
Average velocity =Displacementtime=2sin2
Average acceleration =Change in velocitytime
=2×4sin21=8sin2
Topper's Solved these Questions
- MOTION IN A PALNEBOOK - ALLEN CHAPTER - MOTION IN A PALNEEXERCISE - Assertion-Reason
20 Videos
- MOTION IN A PALNEBOOK - ALLEN CHAPTER - MOTION IN A PALNEEXERCISE - Comprehension#1
3 Videos
- MOTION IN A PALNEBOOK - ALLEN CHAPTER - MOTION IN A PALNEEXERCISE - EXERCISE-02
37 Videos
- KINEMATICS-2DBOOK - ALLEN CHAPTER - KINEMATICS-2DEXERCISE - Exercise (O-2)
47 Videos
- NEWTON'S LAWS OF MOTION & FRICTIONBOOK - ALLEN CHAPTER - NEWTON'S LAWS OF MOTION & FRICTIONEXERCISE - EXERCISE (JA)
4 Videos
Similar Questions
An iron ball and a wooden ball of the same radius are released from a height ‘ h ’ in vacuum. The time taken by both of them to reach the ground is
View SolutionWhich of the following statements is incorrect?
(i) Average velocity is path length divided by time interval.
(ii) In general, speed is greater than the magnitude of the velocity.
(iii) Average velocity is diplacement divided by time interval.
(iv) The magnitude of average velocity is the average speed.
View SolutionThe distance x of a particle moving in one dimensions, under the action of a constant force is related to time t by the equation, t=√x+3, where x is in metres and t in seconds. Find the displacement of the particle when its velocity is zero.
View SolutionA particle is moving in xy-plane .At certain instant the components of its velocity and acceleration are as follows ux=3m/s,uy=4m/s,ax=2m/s2anday=1m/s2. The rate of change of speed at this moment is
View SolutionA piece of wire is bent in the shape of a parabola y=kx2 (y-axis vertical) with a bead of mass m on it. The bead can slide on the wire without friction. It stays at the lowest point of the parabola when the wire is at rest. The wire is now accelerated parallel to the x-axis with a constant acceleration a. The distance of the new equilibrium position of the bead, where the bead can stay at rest with respect to the wire, from the y-axis is:
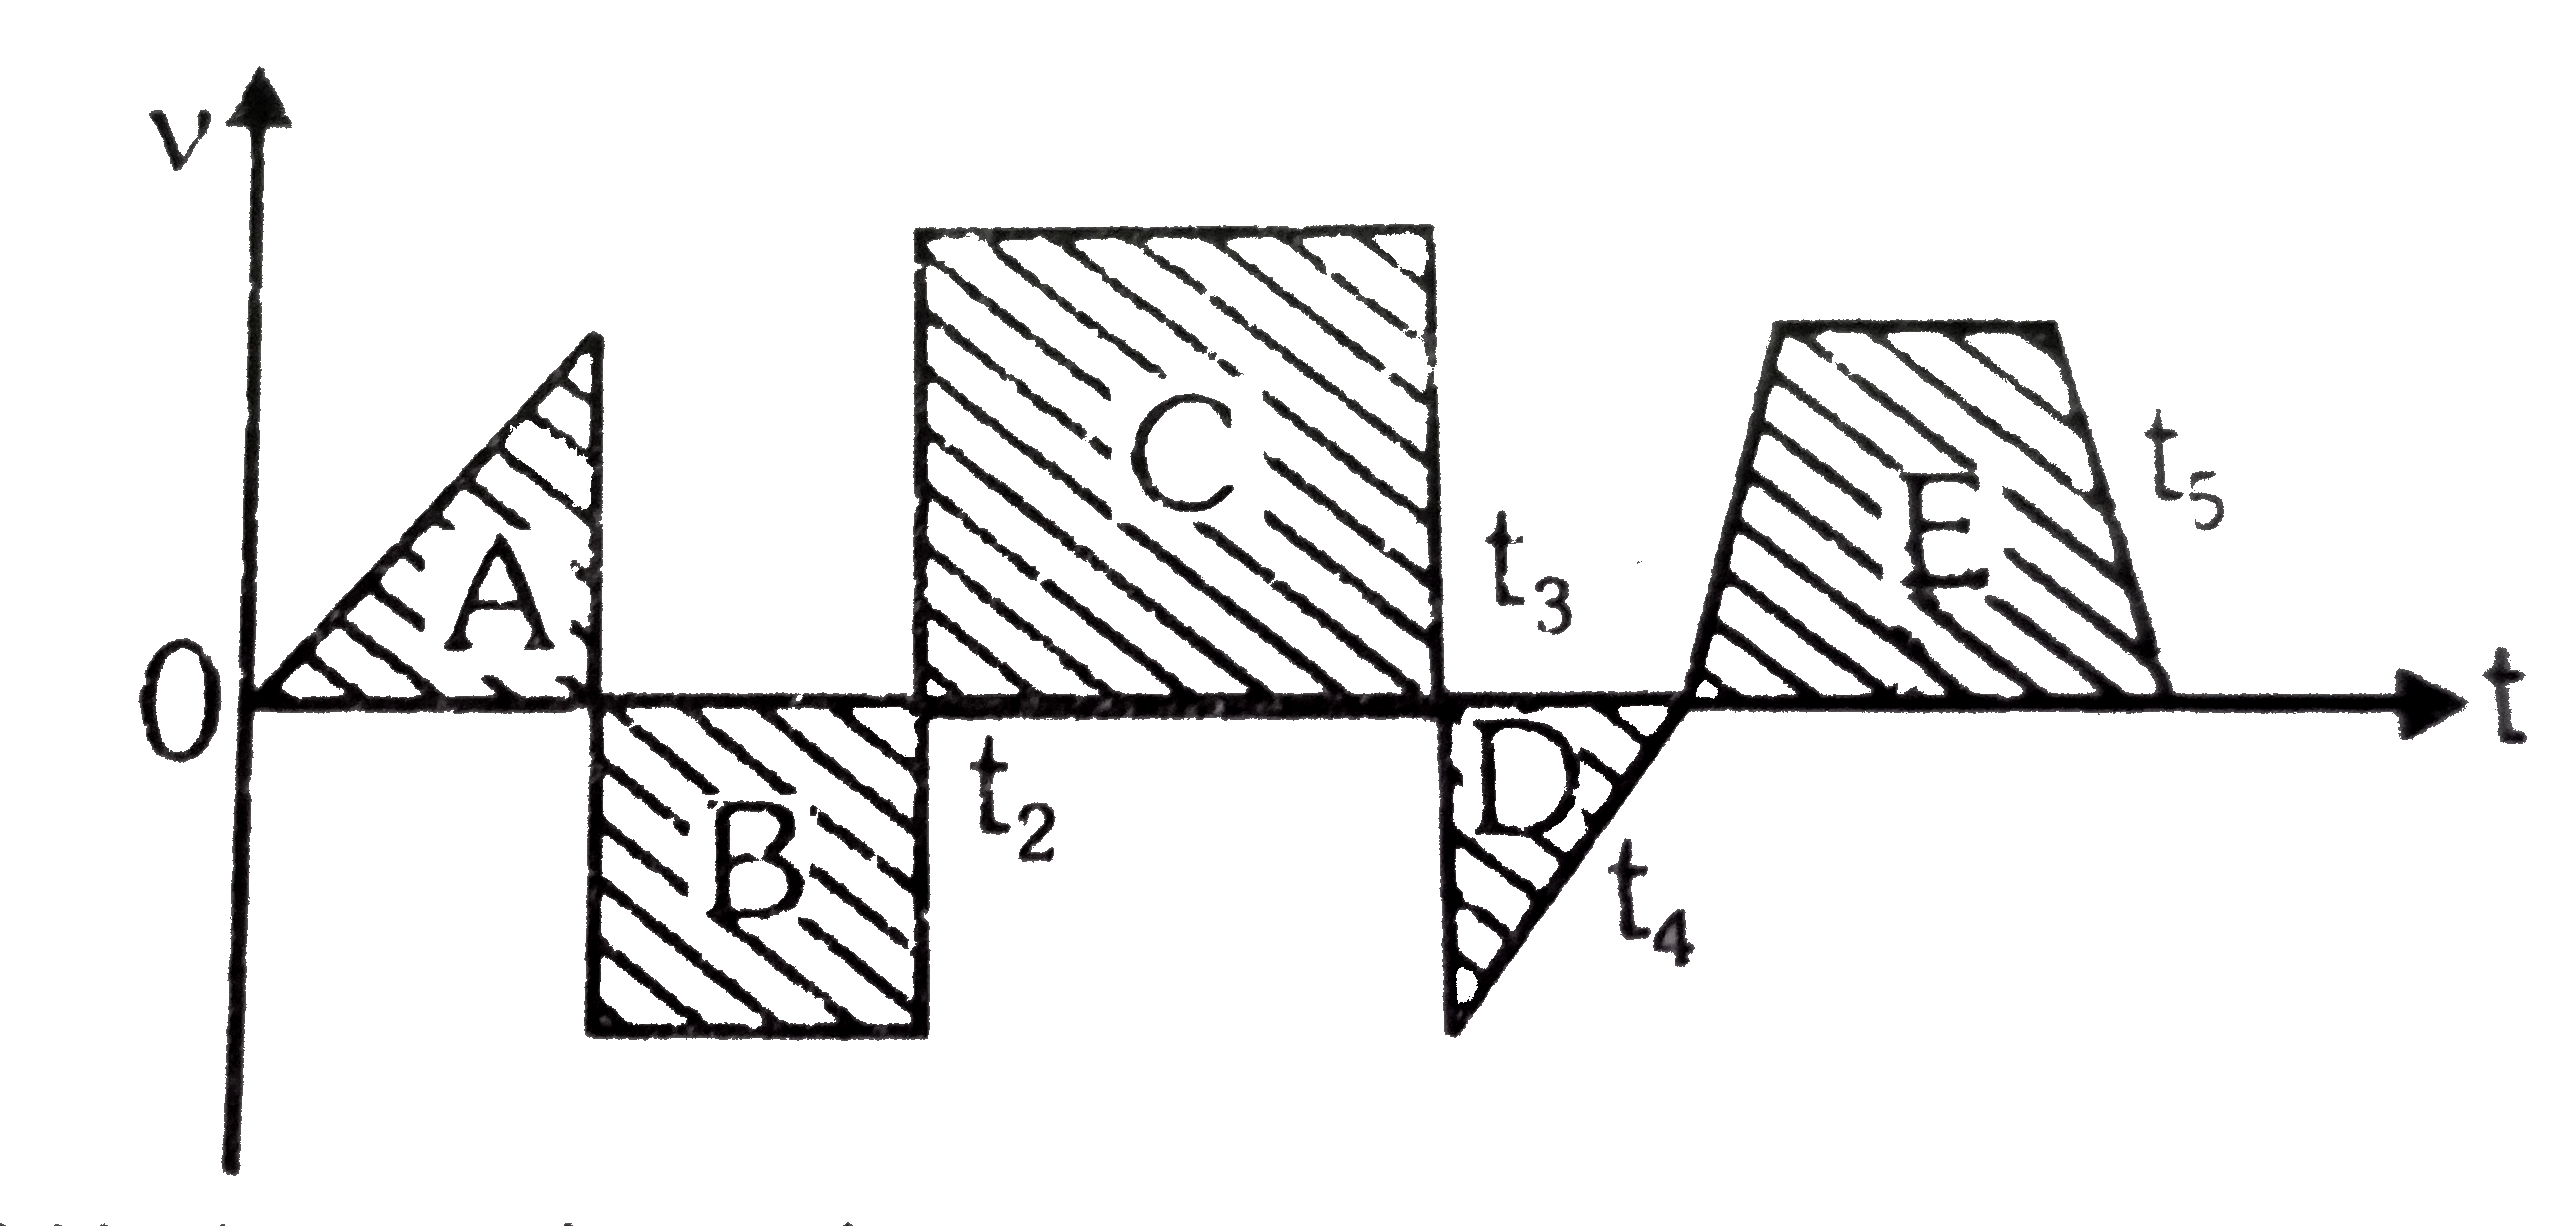
View SolutionThe velocity-time graph of an objects is as shown. The displacement during the interval 0 to t4 is
View Solutionएक वस्तु एक नियत त्वरण से गतिशील है । इस वस्तु की गति का समय-त्वरण , समय वेग एवं एवं-समय -विस्थापन आरेख बनाइए।
View Solutionनिम्नांकित चित्र (a) में एक गतिशील वस्तु का समय-विस्थापन ग्राफ प्रदर्शित हैं । इसकी सहायता से इसका वेग-समय ग्राफ बनाइए और इस ग्राफ से समझाइए कि :
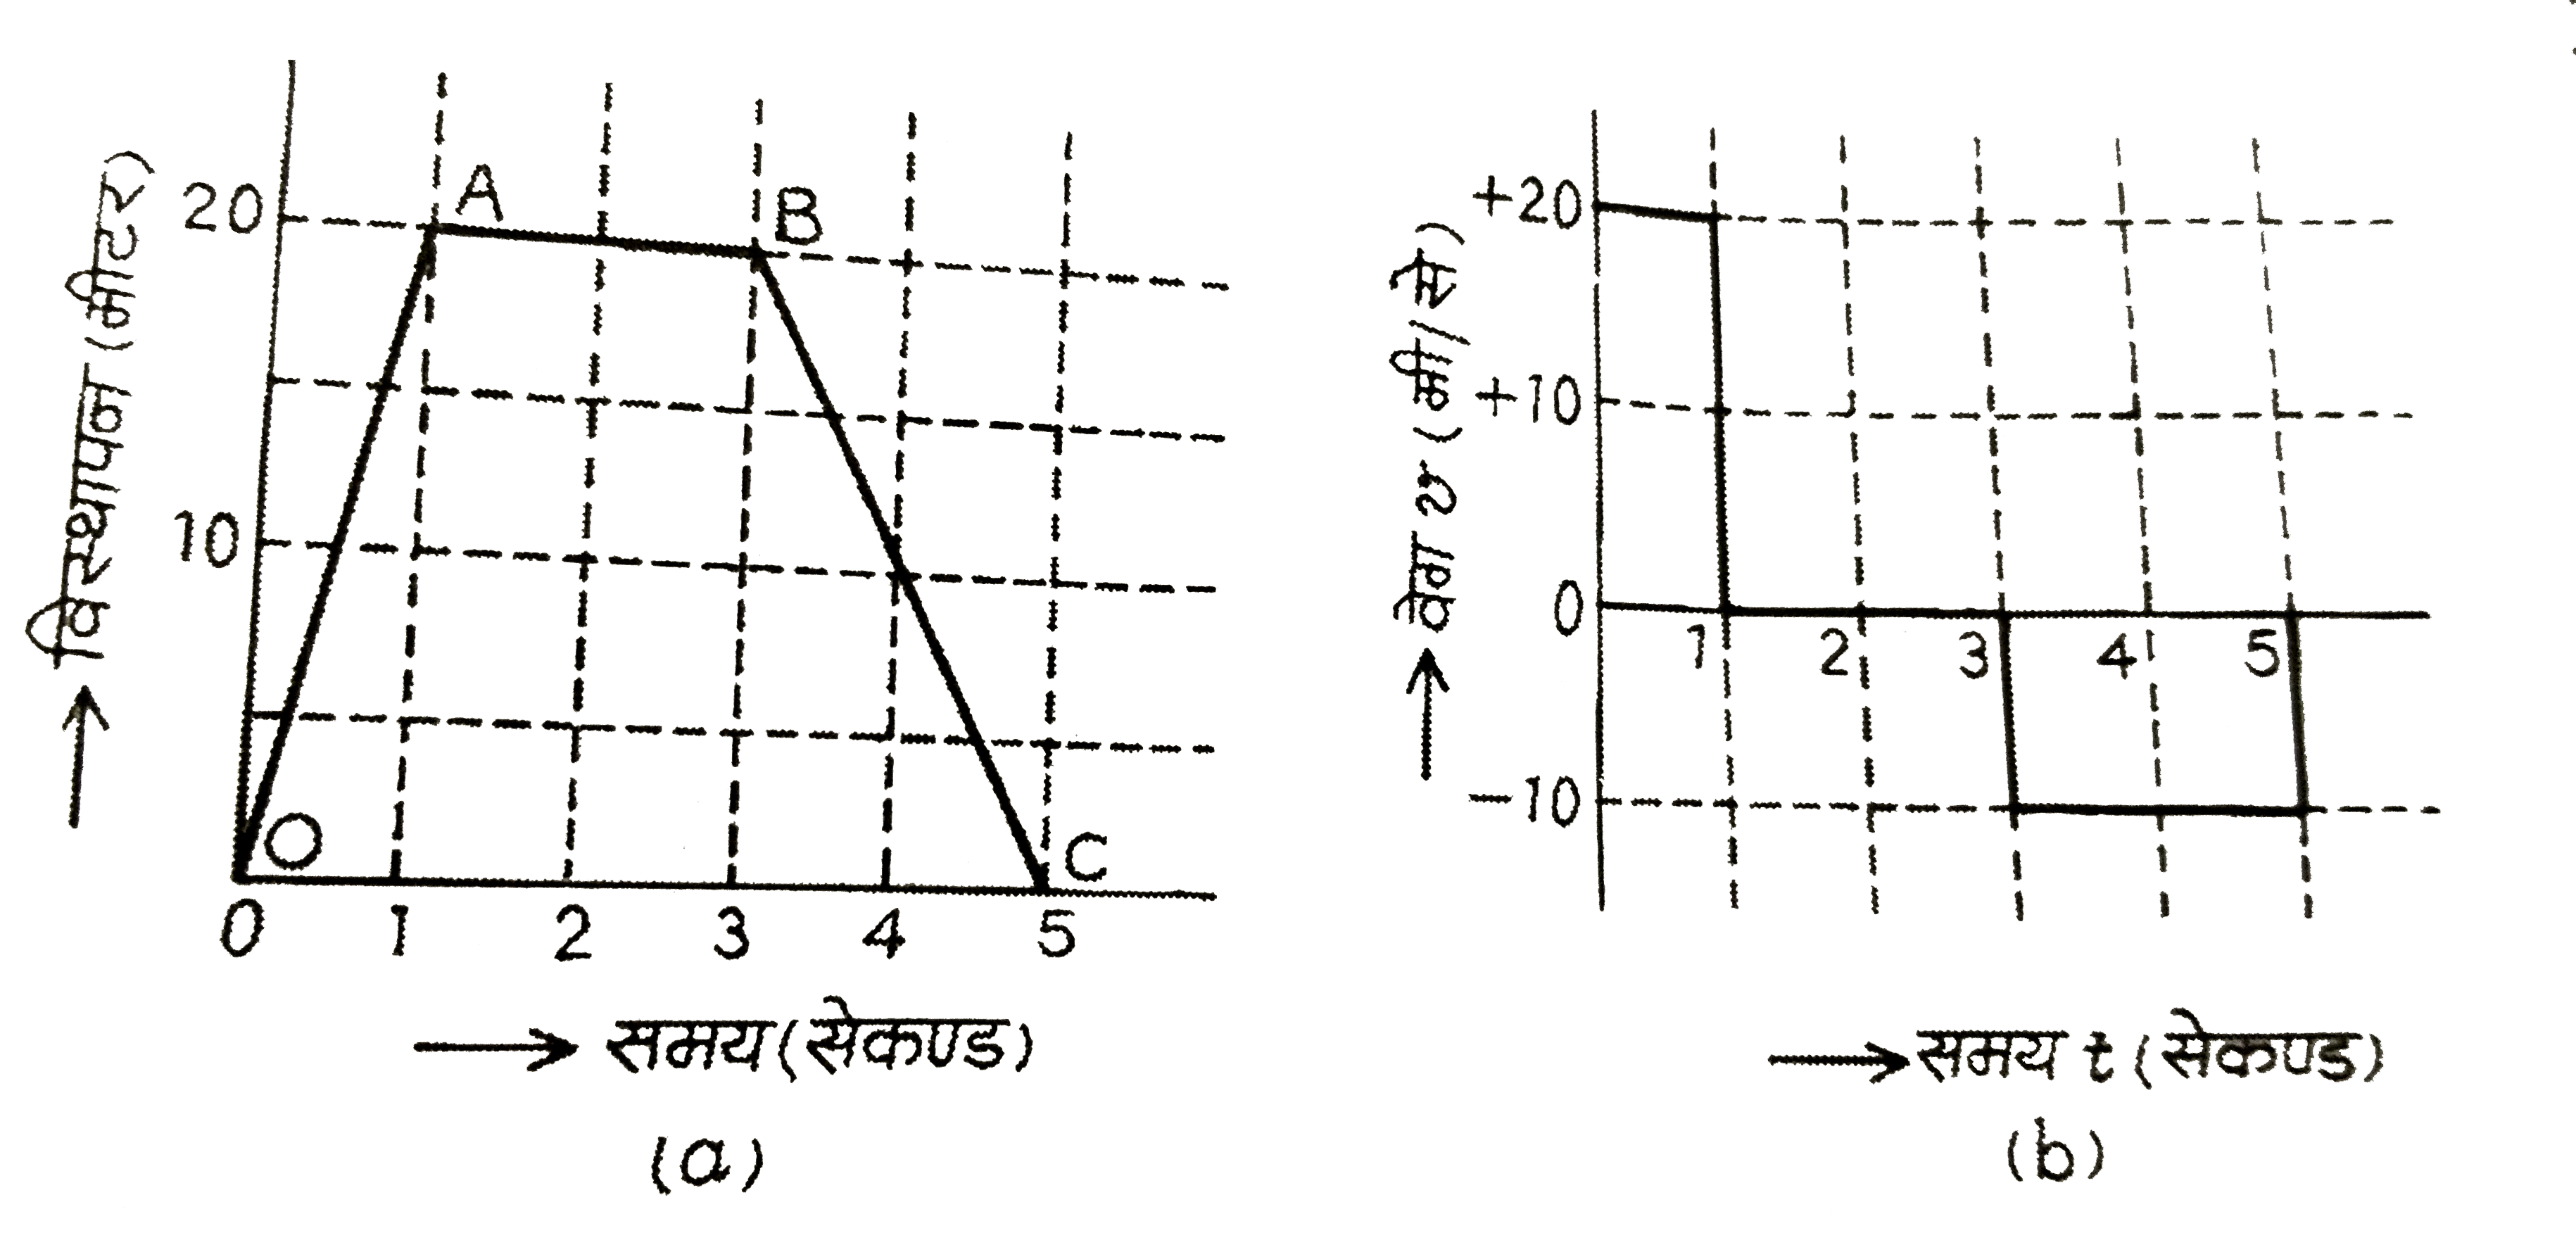
(i) वस्तु सबसे तेज किस समय-अन्तराल में चल रही थी ?
(ii) वस्तु ने कुल कितनी दूरी तय की ?
(iii) वस्तु का सम्पूर्ण विस्थापन कितना है?
(iv) आरम्भ से बिन्दु A तक वस्तु का त्वरण कितना है ?
View Solutionसिद्ध कीजिए कि एकसमान त्वरित गति में वेग - समय ग्राफ तथा समय अक्ष के बीच घिरा क्षेत्रफल उस समय - अंतराल में वस्तु के विस्थापन के बराबर होता है ।
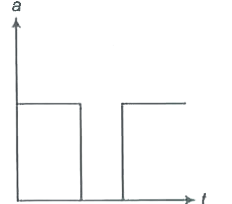
View Solutionचित्र में किसी वस्तु के लिए त्वरण-समय ग्राफ प्रदर्शित किया गया है। इसी वस्तु के लिए वेग-समय ग्राफ होगा
View SolutionVelocity - time graph of a moving object is shown below. What is the acceleration of the object? Also draw displacement - time graph for the motion of the object?
View Solutionकिसी गतिशील वस्तु का वेग-समय ग्राफ चित्र में दर्शाया गया है। उस समयान्तराल में, जिसमें वस्तु का त्वरण तथा मंदन अशून्य रहता है, कुल विस्थापन है
View Solutionप्रक्कथन : उच्च वेग से गति करती हुई वस्तु के विस्थापन समय ग्राफ का ढाल कम वेग से गति करती हुई वस्तु के विस्थापन-समय ग्राफ के ढाल से तीव्र (अधिक) होता है।
कारण : विस्थापन-समय ग्राफ का ढाल = वस्तु का वेग।
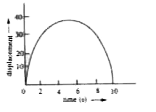
View SolutionThe displacement-time graph of a moving object is shown in figure. Which of the velocity-time graphs shown in figure could represent the motion of the same body ?
View SolutionThe velocity-time graph of an object is shown in the diagram, the displacement of the object in 5 seconds will be:
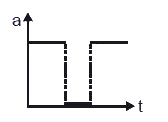
View Solutionकिसी वस्तु के लिये त्वरण-समय ग्राफ चित्र में दिखाया गया है। तो संगत वेग-समय ग्राफ होगा :
View Solution
