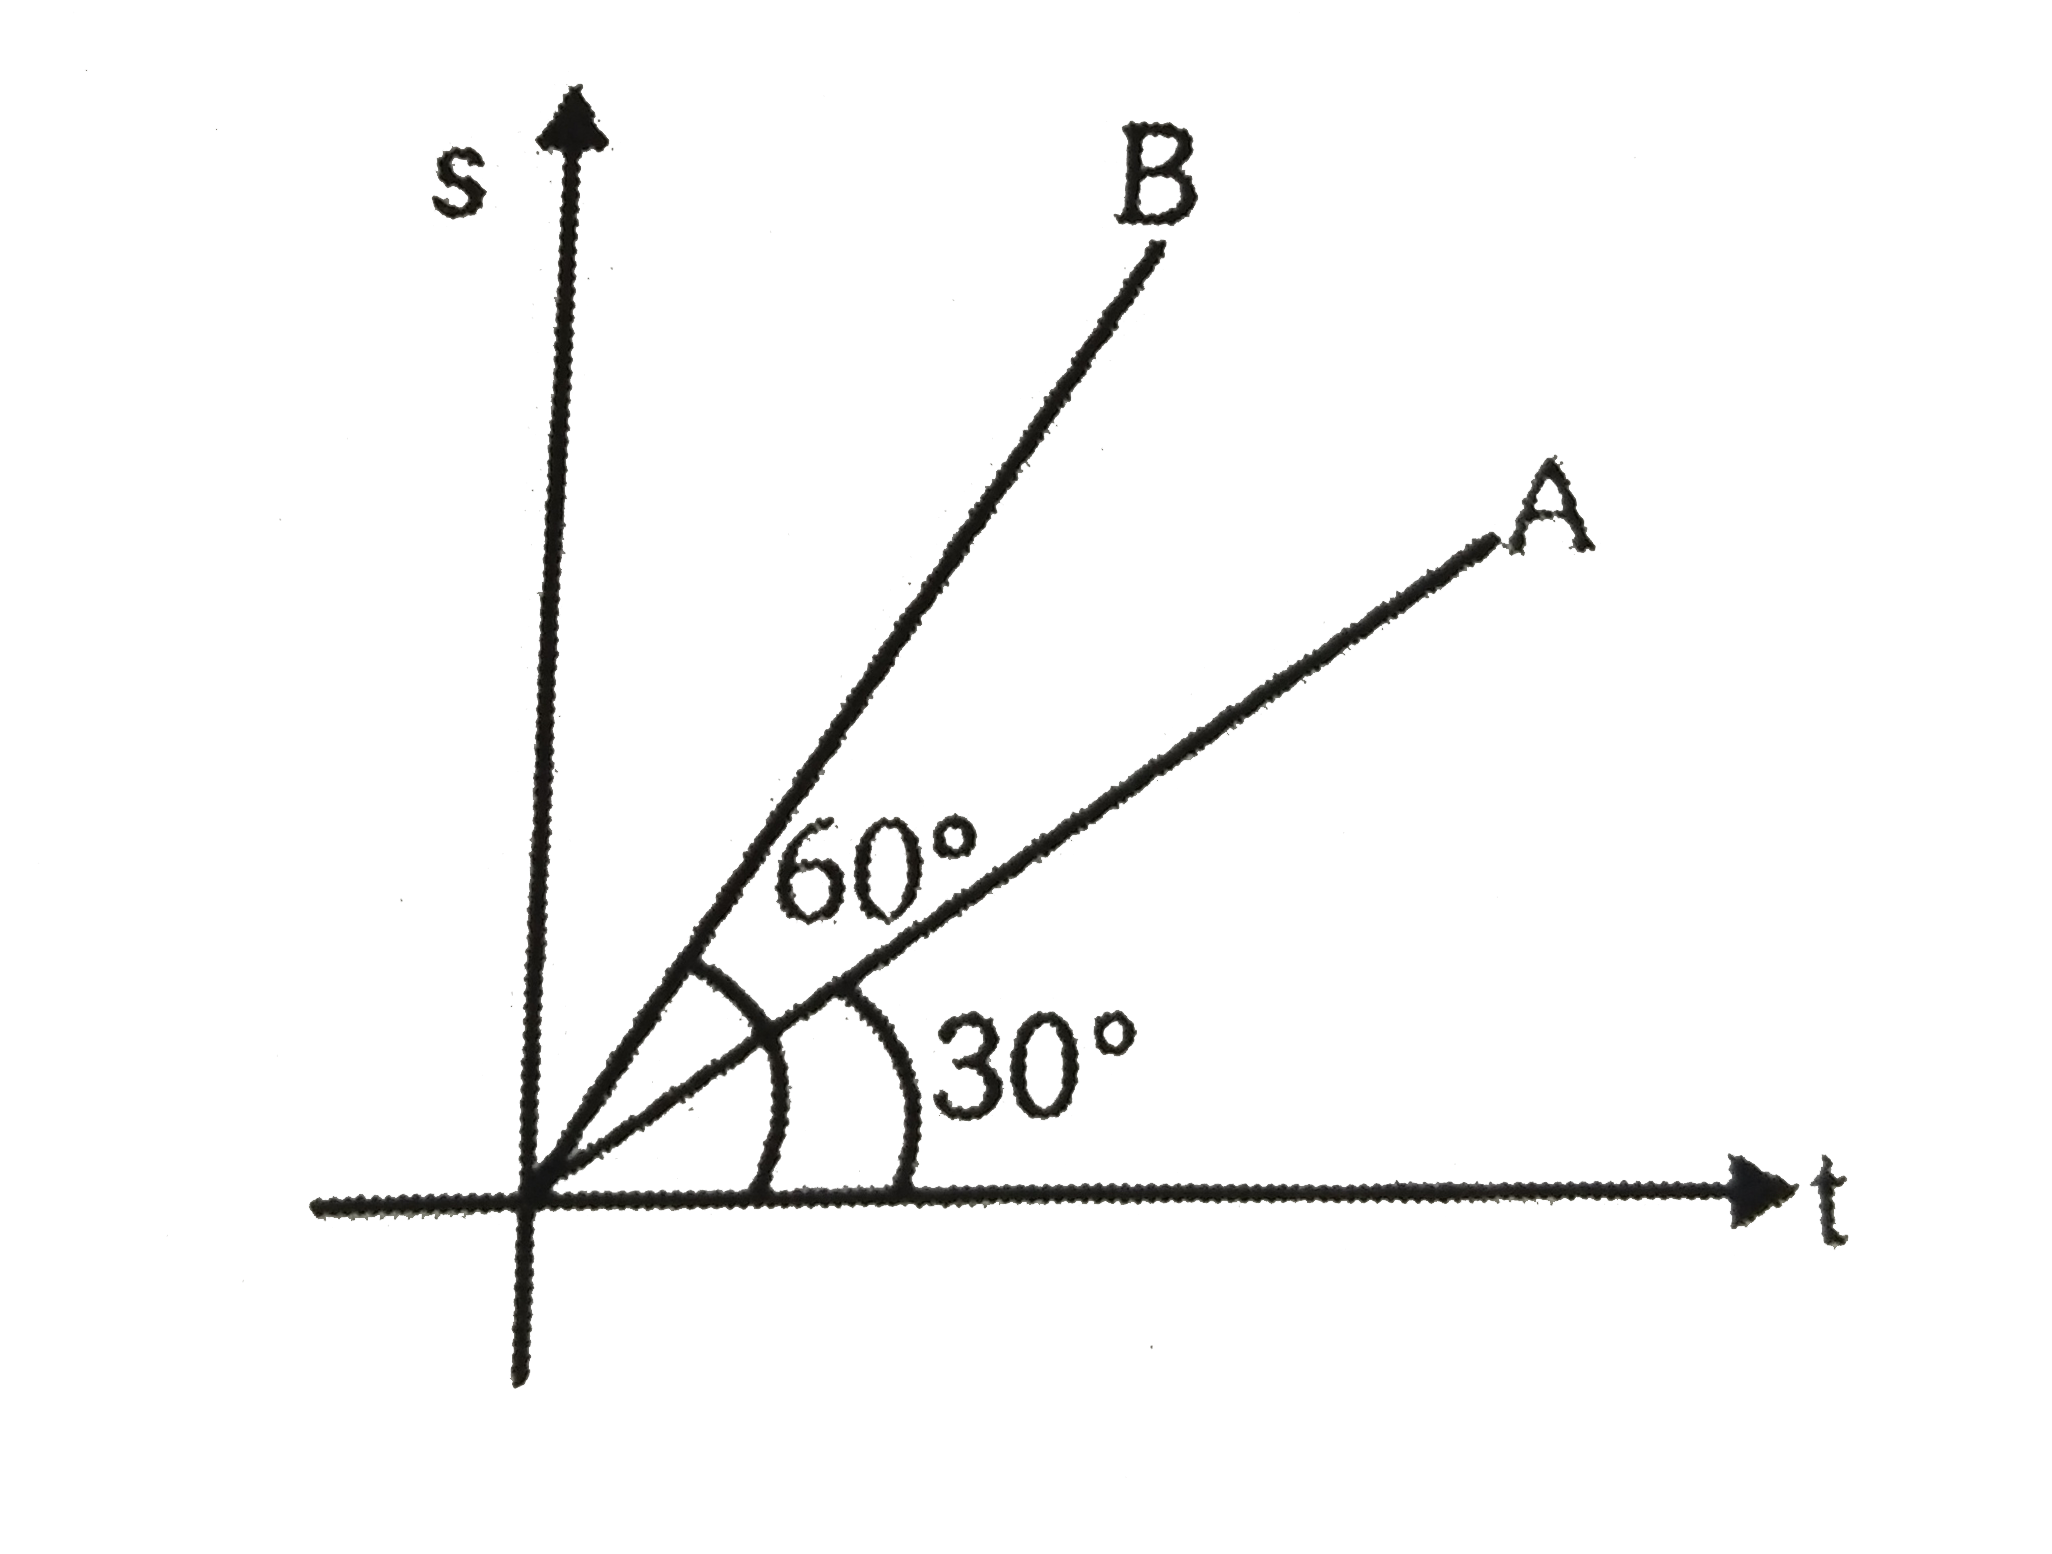
s-t graph of two particles A and B are shown in fig. Find the ratio of velocity of A to velocity of B.
 Solution in Gujrati
Velocity = Slope of s - t curve
So vAvB=Slope of ASlope of B=tan30∘tan60∘=13
Topper's Solved these Questions
- KINEMATICS (MOTION ALONG A STRAIGHT LINE AND MOTION IN A PLANE)BOOK - ALLEN CHAPTER - KINEMATICS (MOTION ALONG A STRAIGHT LINE AND MOTION IN A PLANE)EXERCISE - BEGINNER S BOX-6
9 Videos
- KINEMATICS (MOTION ALONG A STRAIGHT LINE AND MOTION IN A PLANE)BOOK - ALLEN CHAPTER - KINEMATICS (MOTION ALONG A STRAIGHT LINE AND MOTION IN A PLANE)EXERCISE - BEGINNER S BOX-7
8 Videos
- KINEMATICS (MOTION ALONG A STRAIGHT LINE AND MOTION IN A PLANE)BOOK - ALLEN CHAPTER - KINEMATICS (MOTION ALONG A STRAIGHT LINE AND MOTION IN A PLANE)EXERCISE - BEGINNER S BOX-4
6 Videos
- KINEMATICSBOOK - ALLEN CHAPTER - KINEMATICSEXERCISE - EXERCISE-2
89 Videos
- MISCELLANEOUSBOOK - ALLEN CHAPTER - MISCELLANEOUSEXERCISE - Question
1 Videos
Similar Questions
A particle is projected vertically upwards from ground with velocity 10 m/s. Find the time taken by it to reach at the highest point ?
View SolutionA football player kicks a ball at an angle of 30∘ with an initial speed of 20 m/s. Assuming that the ball travels in a vertical plane, calculate (a) the time at which the ball reaches the highest point (b) the maximum height reached (c) the horizontal range of the ball (d) the time for which the ball is in the air, (g=10m/s2)
View SolutionA particle starts from the rest, moves with constant acceleration for 15s. If it covers s1 distance in first 5s then distance s2 in next 10s, then find the relation between s1&s2.
View SolutionA student performs an experiment to determine how the range of a ball depends on the velocity with which it is projected. The "range" is the distance between the points where the ball lends and from where it was projected, assuming it lands at the same height from which it was projected. It each trial, the student uses the same baseball, and launches it at the same angle. Table shows the experimental results.
∣∣ ∣ ∣ ∣ ∣ ∣∣TrailLaunch speed(m/s)Range(m)110822031.833070.7440122.5∣∣ ∣ ∣ ∣ ∣ ∣∣
Based on this data, the student then hypothesizes that the range, R, depends on the initial speed v0 according to the following equation : R=Cvn0, where C is a constant and n is another constant.
Based on this data, the best guess for the value of n is :-
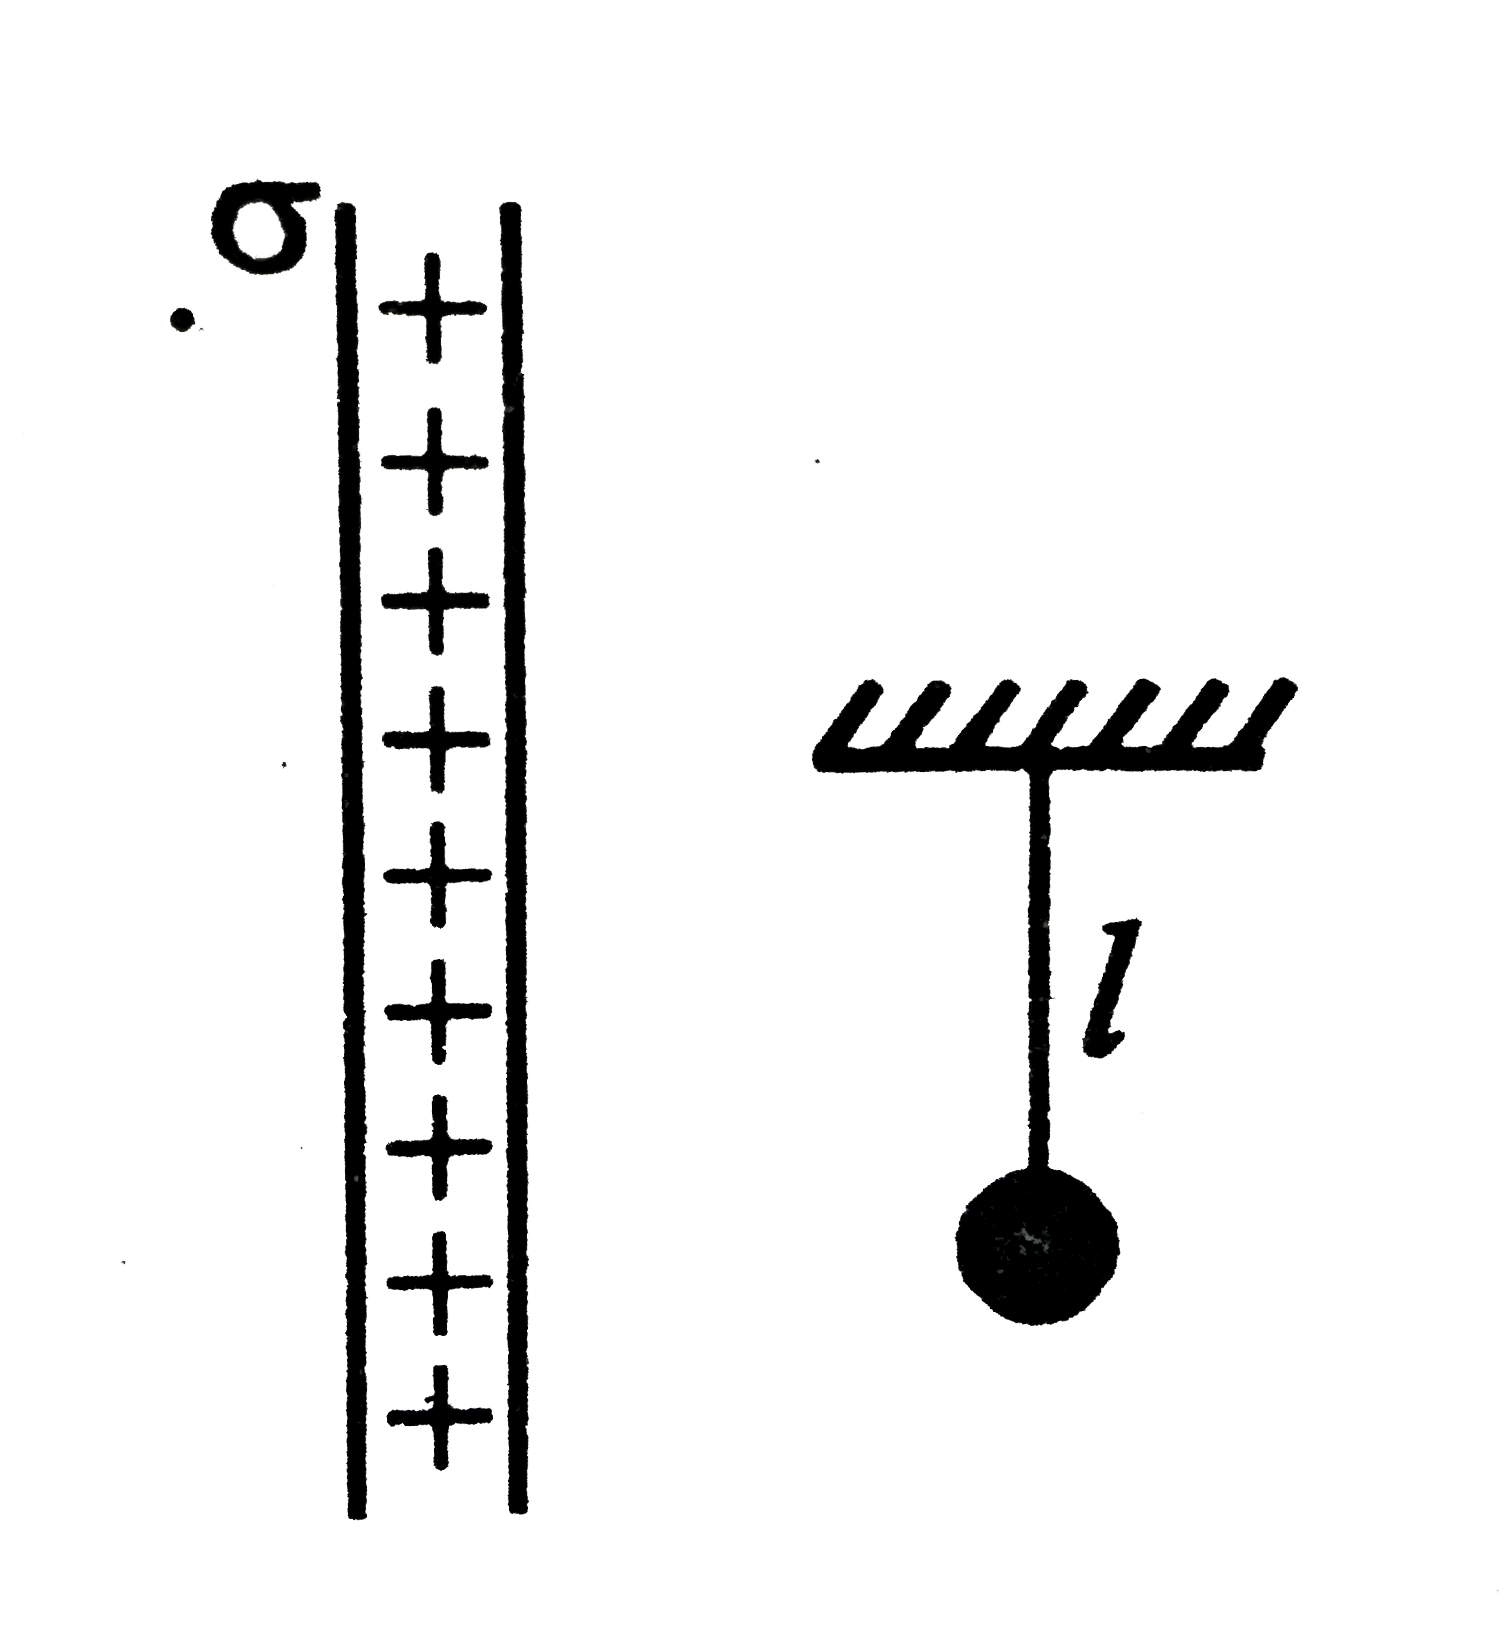
View SolutionA simple pendulum of length l and bob mass m is hanging in front of a large nonconducting sheet having surface charge density σ. If suddenly a charge +q is given to the bob & it is released from the position shown in figure. Find the maximum angle through which the string is deflected from vertical .
 .
.
View Solutions-t graph of a particle in motion is as shown below. (a) State, whether the given graph represents a uniform motion or not. (b) Find velocity of the particle.
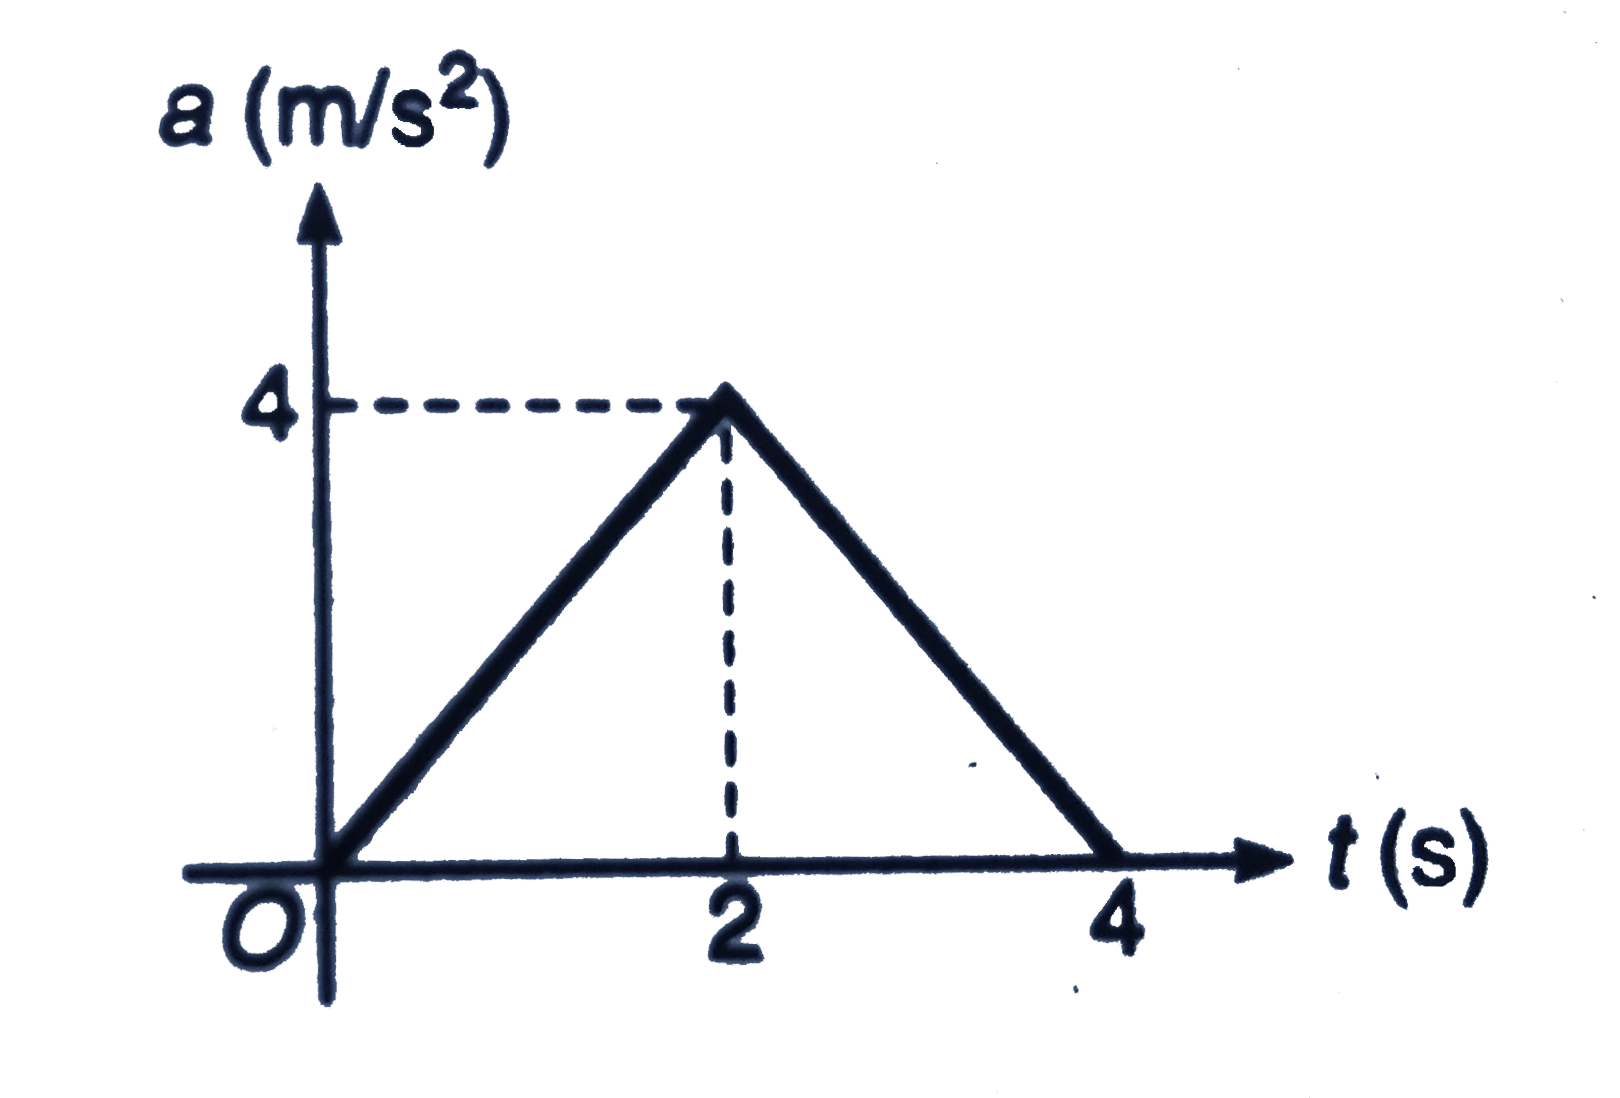
View SolutionAccleration-time graph of a particle moving in a straight line is as shown in Fig. Velocity of particle at time t=0 is 2m/s. Find the velocity at the end of fourth second.
View SolutionVelocity-time graph of a particle moving in a straight line is shown in figure. In the time interval from t=0 to t=14s, find
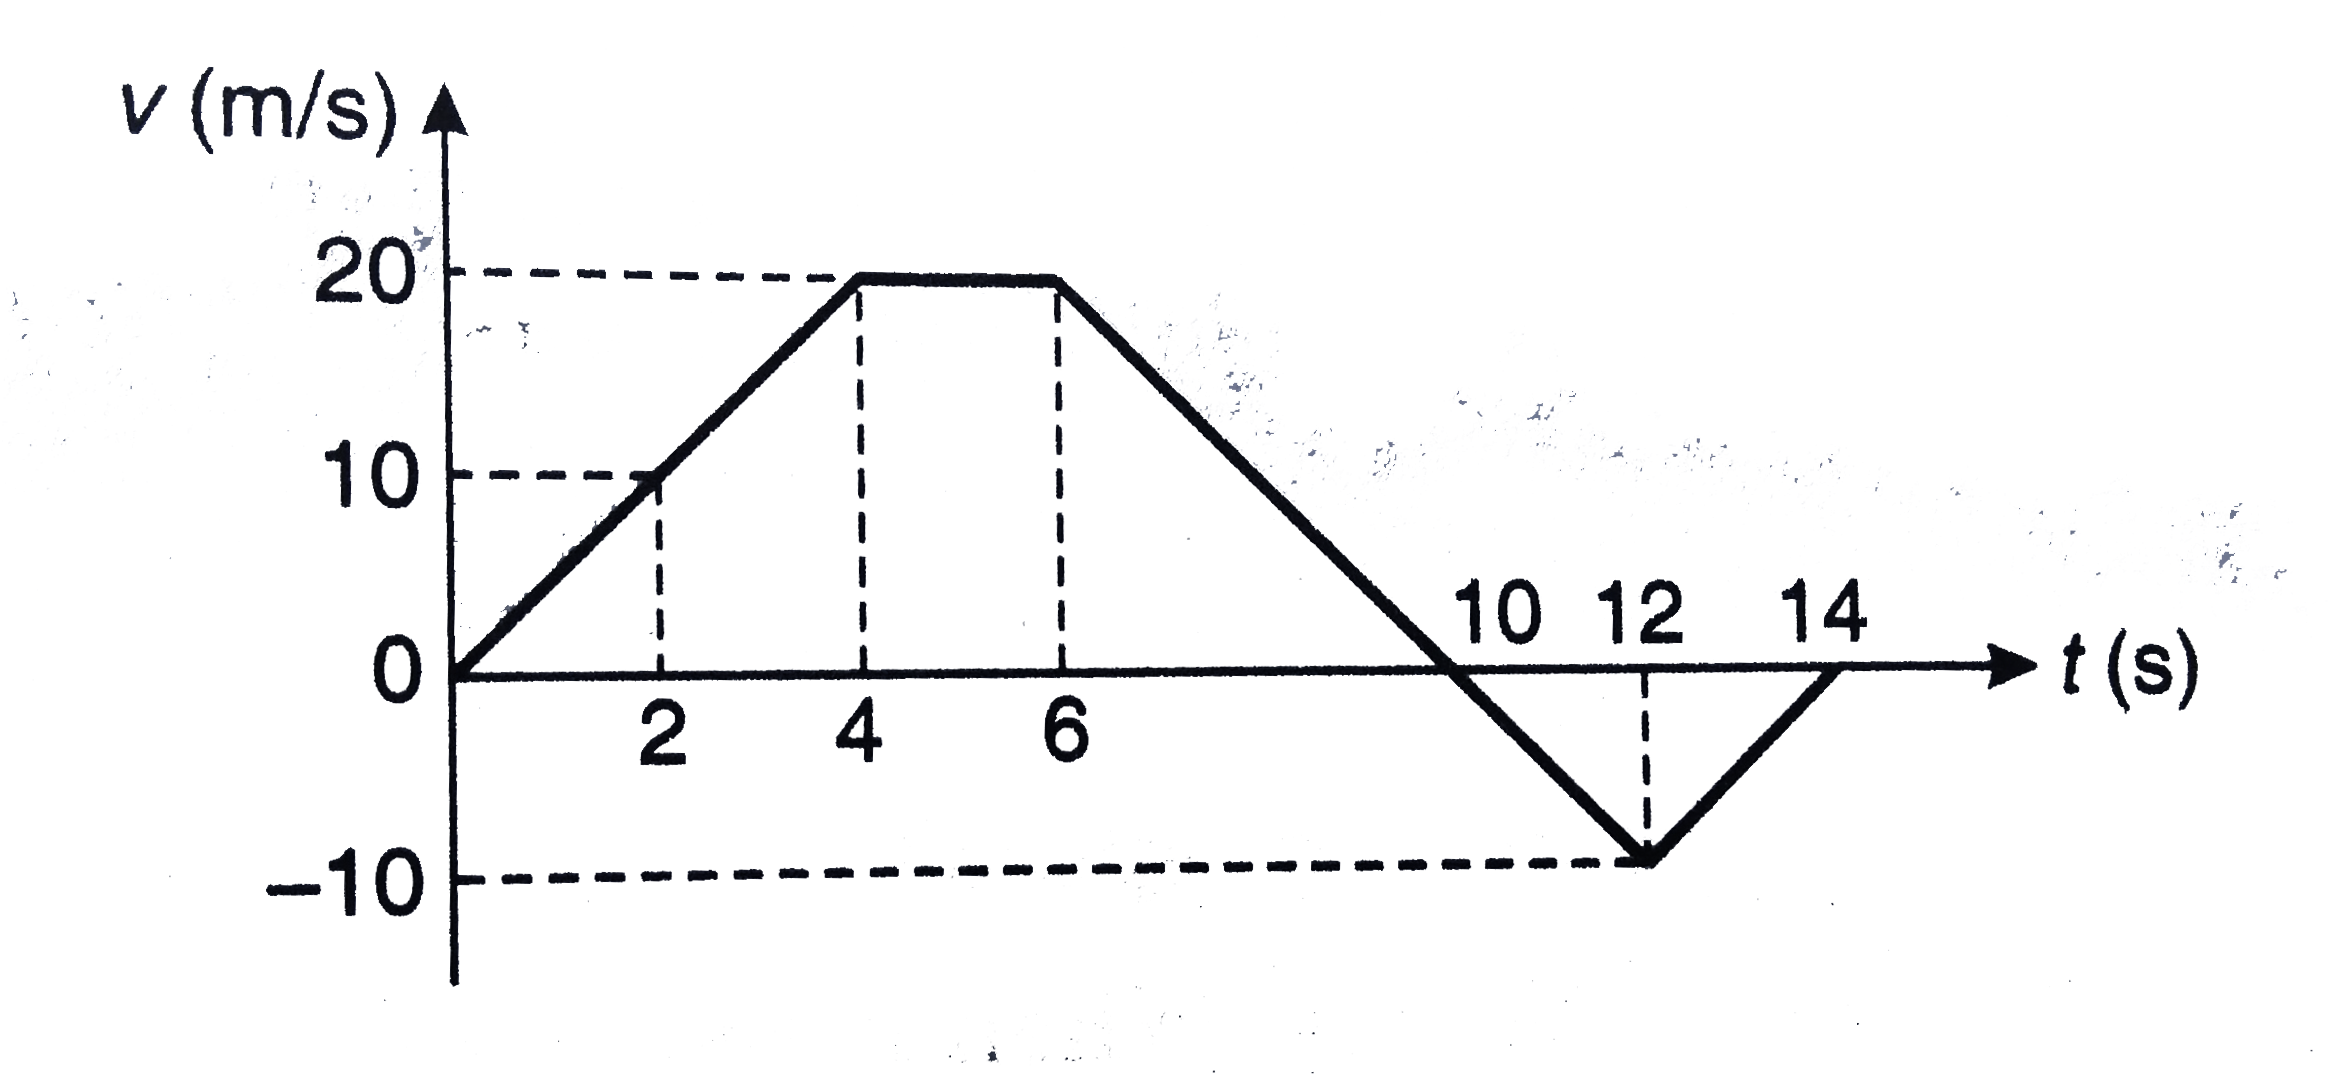
(a) average velocity and
(b) average speed of the particle.
View SolutionTwo particles A and B are moving with uniform velocity as shown in (Fig. 5.130) given below at t = 0 . (a) Will the two particles collide ? (b) Find out the shortest distance between two particles. .
View SolutionThe displacement-time graph for two particles is as shown. Find the ratio of their velocities.
View SolutionThe displacement time graphs of two bodies A and B are shown in figure. The ratio of velocity of A to velocity of B,vA/vB is:

View Solutions-t graph of two particles A and B are shown in fig. Find the ratio of velocity of A to velocity of B.
View Solutions-t graph of a particle in motion is shown in Fig. Calculate
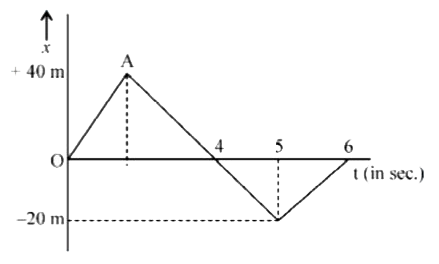
Average velocity
View SolutionThe velocity - time graph for two bodies A and B are in the ratio
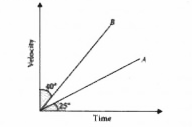
View Solutions-t graph of a particle in motion is as shown below.

(a) State, whether the given graph represents a uniform motion or not.
(b) Find velocity of the particle.
View SolutionAccleration-time graph of a particle moving in a straight line is as shown in Fig. Velocity of particle at time t=0 is 2m/s. Find the velocity at the end of fourth second.

View Solution
