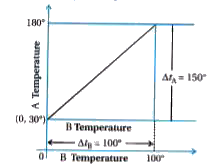
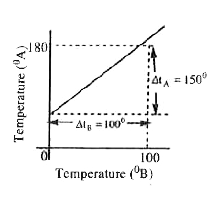
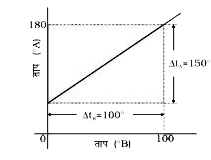
The graph between two temperature scales A and B is shown in Fig. Between upper fixed point and lower fixed point there are 150 equal divisions on scales A and 100 on scale B. The relation between the temperature in two scales is given by_
_S01_001_Q01.png) Solution in Gujrati
Solution in Gujrati
tA−180100=tB150
tA−30150=tB100
tA−180150=tA100
tB−40100=tA180
The correct Answer is:B
Step by step video & image solution for The graph between two temperature scales A and B is shown in Fig. Between upper fixed point and lower fixed point there are 150 equal divisions on scales A and 100 on scale B. The relation between the temperature in two scales is given by_ by Physics experts to help you in doubts & scoring excellent marks in Class 12 exams.
Updated on:21/07/2023Topper's Solved these Questions
- RACEBOOK - ALLEN CHAPTER - RACEEXERCISE - Basic Maths (Thermal Physics) (Calorimetry)
14 Videos
- RACEBOOK - ALLEN CHAPTER - RACEEXERCISE - Basic Maths (Thermal Physics) (Mode of Heat Transfer)
15 Videos
- RACEBOOK - ALLEN CHAPTER - RACEEXERCISE - Basic Maths (Properties of Matter & Fluid Mechanics)(Surface Tension)
26 Videos
- NEWTONS LAWS OF MOTIONBOOK - ALLEN CHAPTER - NEWTONS LAWS OF MOTIONEXERCISE - EXERCISE-III
28 Videos
- SIMPLE HARMONIC MOTIONBOOK - ALLEN CHAPTER - SIMPLE HARMONIC MOTIONEXERCISE - Example
1 Videos
Similar Questions
Two liquids A and B are at 30∘C and 20∘C, respectively When they are mixied in equal masses, the temperature of the mixture is found to be 26∘C. The ratio of their specific heat is
View SolutionThree identical rods have been joined at a junction to make it a Y shape structure. If two free ends are maintained at 60∘C and the third end is at 0∘C, then what is the junction temperature θ ?

View SolutionWater rises to a height of 10cm in a glass capillary tube. If the area of cross section of the tube is reduced to one fourth of the former value what is the height of water rise now?
View SolutionAssertion: The driver in a vechicle moving with a constant speed on a straight road is in a non-inertial frame of referance.
Reason: A reference frame in which Newton's laws of motion are applicable is non-inertial.
View SolutionA rod with rectangular cross section oscillates about a horizontal axis passing through one of its ends and it behaves like a seconds pendulum, its length will be
View SolutionThe graph between two temperature scales A and B is shown in Fig. Between upper fixed point and lower fixed point there are 150 equal divisions on scales A and 100 on scale B. The relation between the temperature in two scales is given by_
_S01_001_Q01.png)
View SolutionA faulty thermometer has its lower fixed point marked as 110^(@) and upper fixed point marked as 110^(@) and upper fixed point marked as 110^(@) . If the temperature of the body shown in this scale is 62^(@) , the temperature shown on the Celsius scale is
View SolutionThe fundamental interval, that is the number of divisions between LFP and UFP on the two scales X and Y are 50 and 150 respectively. The ice point on both the scales is at 0^(@) . If the temperature on the X scaleis 15^(@) , then what is the temperature on the Y-scale?
View Solutionफॉरेनहाइट स्केल का निम्न नियत बिन्दु तथा ऊपरी नियत बिन्दु होता है
View SolutionThe graph between two temperature scales A and B is shown in figure. Between upper fixed point and lower fixed point there are 150 equal division on A and 100 on scale B. The relationship for conversion between the two scales is given by

View SolutionWhat are two fixed points on a temperature scale?
View SolutionThe graph between two temperature scales A and B is shown in Fig. Between upper fixed point and lower fixed point there are 150 equal divisions on scales A and 100 on scale B. The relation between the temperature in two scales is given by_
_S01_001_Q01.png)
View SolutionPassage - I: The graph between two temperature scales A and B is as shown in fig. Between upper fixed and lower fixed points there are 150 equal divisions on scale A and 100 on scale B. Lower fixed point on scale B and scale A.
View SolutionPassage - I: The graph between two temperature scales A and B is as shown in fig. Between upper fixed and lower fixed points there are 150 equal divisions on scale A and 100 on scale B. The relation between two scales A and B is given by
View SolutionThe graph between two temperature scales A and B is shown in Fig. 11.1 Between upper fixed point and lower fixed point there

View Solutionचित्र 11.1 में दो तापक्रमों A तथा B के बीच ग्राफ दर्शाया गया है। स्केल A तथा B पर निम्न नियत तापांक तथा उच्च नियत तापांक के बीच क्रमशः 150 तथा 100 समान भाग है|
दोनों स्केलों के बीच रूपांतरण के लिए दिया गया संबंध है -

View Solution
