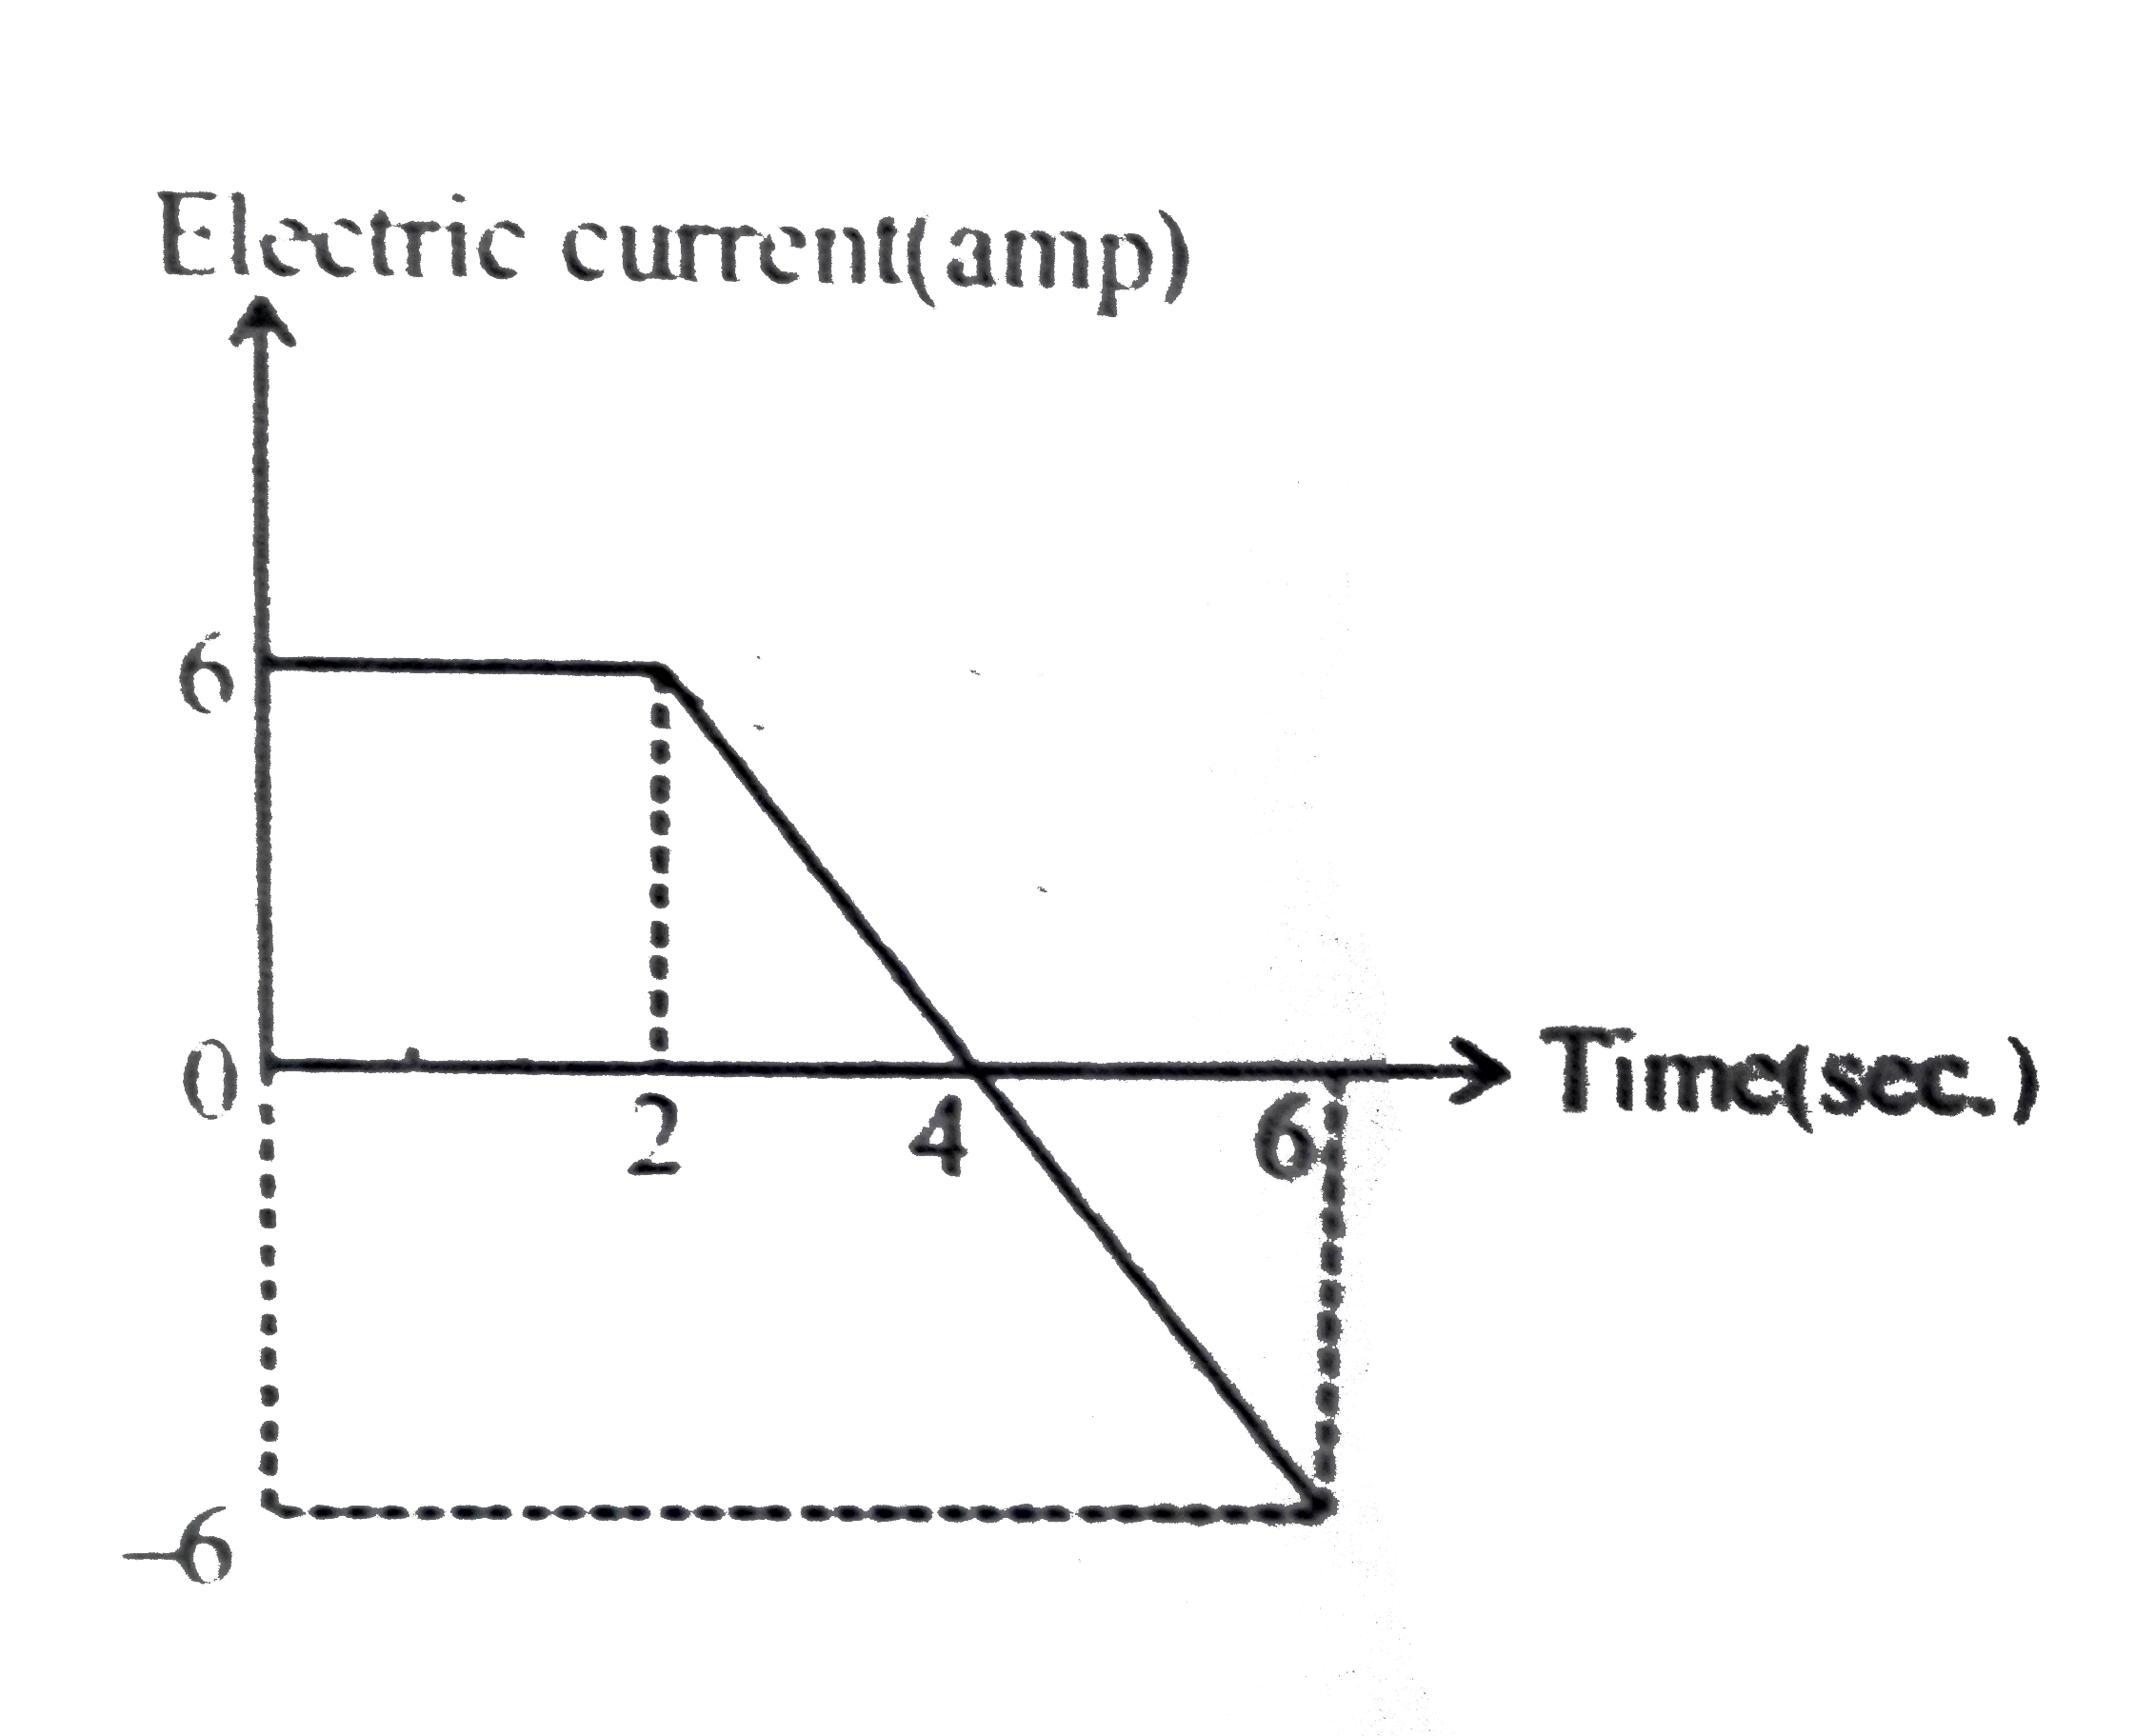
If Electric-current 'i' time (t) graph shown in figure. The average current in first 6 sec. is :-
 Solution in Gujrati
1 amp
2 amp
6 amp
3 amp
The correct Answer is:B
iavg=area under (i-t) vurve(0−6)time interval(0−6)
=6×2(12×2×6)−12×2×66−0
=2amp.
Topper's Solved these Questions
Similar Questions
Consider the statements given below-
(A) The wave and the particle aspects are both neccessary for a complete description of light
(B) The wave and particle aspects cannot be revealed simultaneously in a single experiment. The-
View SolutionIf complex number z(z≠2) satisfies the equation z2=4z+|z|2+16|z|3, then what is the value of |z|4 ?
View SolutionThe potential difference a 2 H inductor as a function of time is shown in figure. At time t = 0 , current is zero Current versus time graph across the inductor will be
View SolutionThe current through a 4.6 H inductor is shown in the following graph. The induced emf during the time interval t = 5 milli - sec to 6 milli - sec will be
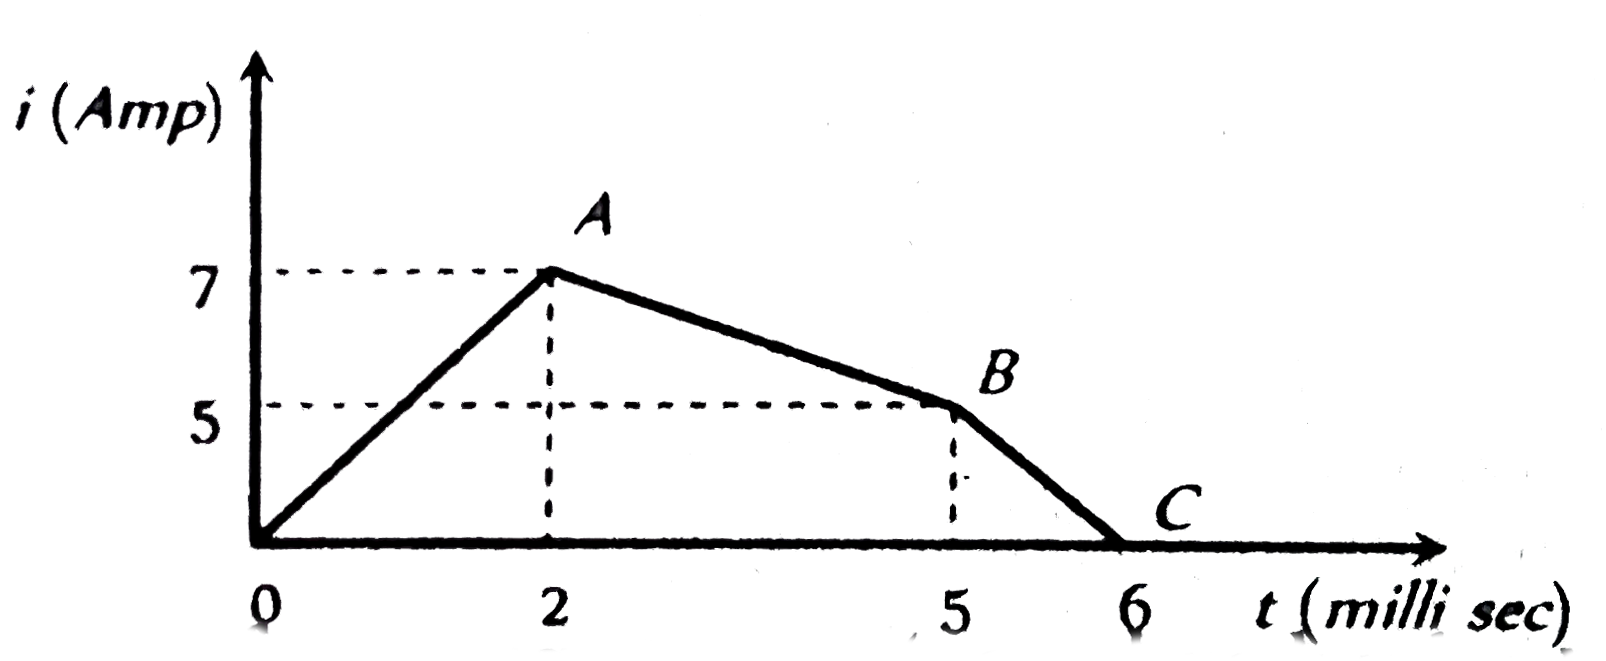
View SolutionThe current i in an induction coil varies with time t according to the graph shown in the figure-5.250. Which of the following graphs shows the induced EMF in the coil with time ?
View SolutionThe potentiak difference across a 2H inductor as a function of time is shown in the figure. At time t=0, current is zero. Current versus time graph across the inductor will be
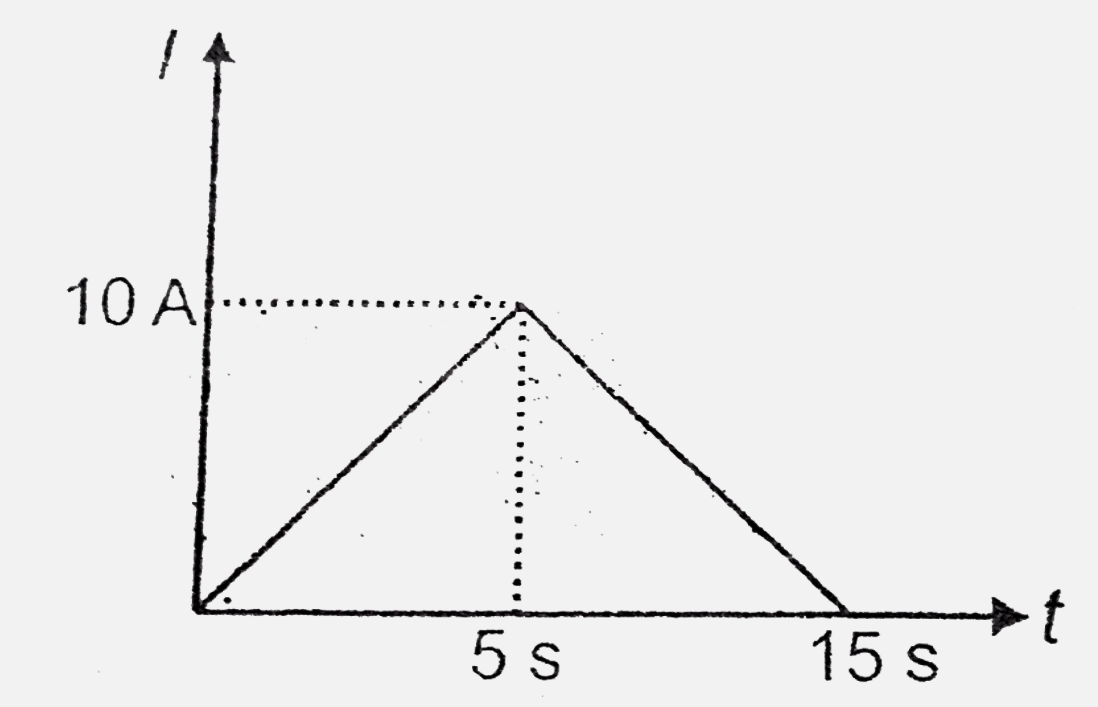
View SolutionCurrent l versus time t graph through a conductor is shown in the figure. Average current through the conductor in the interval 0 to 15 s is
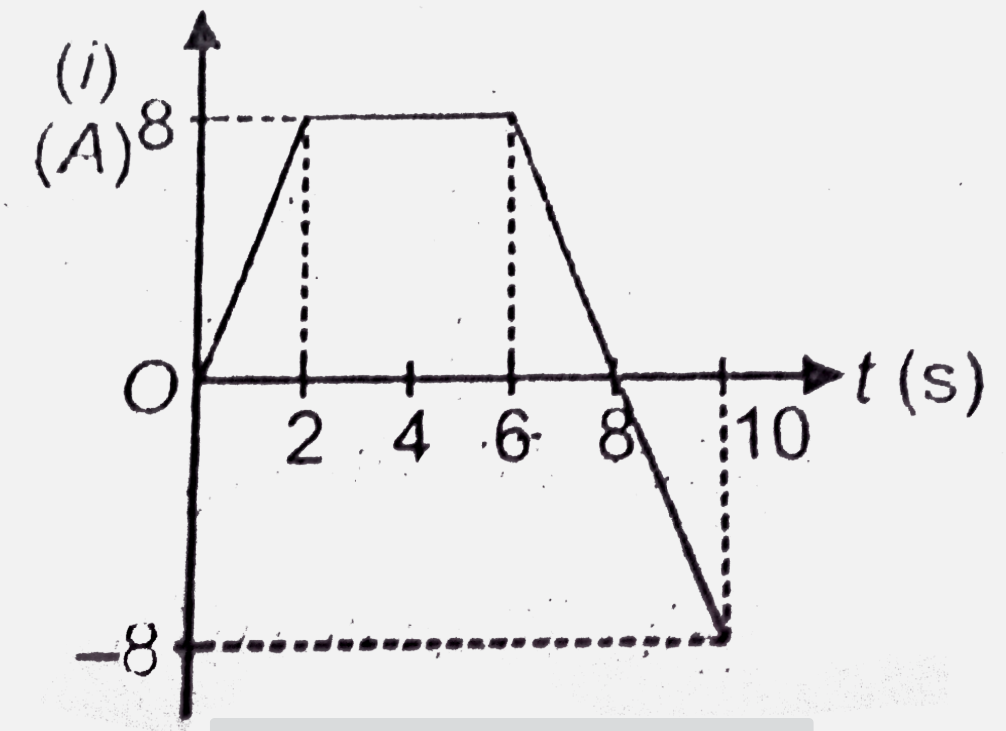
View SolutionThe current I through a conductor varies with time t as shown in figure. The average electric current during t=0 to t=10 s will be
View SolutionThe variation of current with time in a wire was shown in graph given below. Find flowing in 6 sec current (Amp time)
View SolutionThe variation of current with time in a wire was shown in graph given below. Find amount of charge flowing in 6 sec M current (Amp)2 time sec) 2 3 4 5 6
View SolutionThe electric current in a circuit is given by i=3t. Find the rms current for the period t=0 to t=1 sec.
View SolutionThe potentiak difference across a 2H inductor as a function of time is shown in the figure. At time t=0, current is zero.
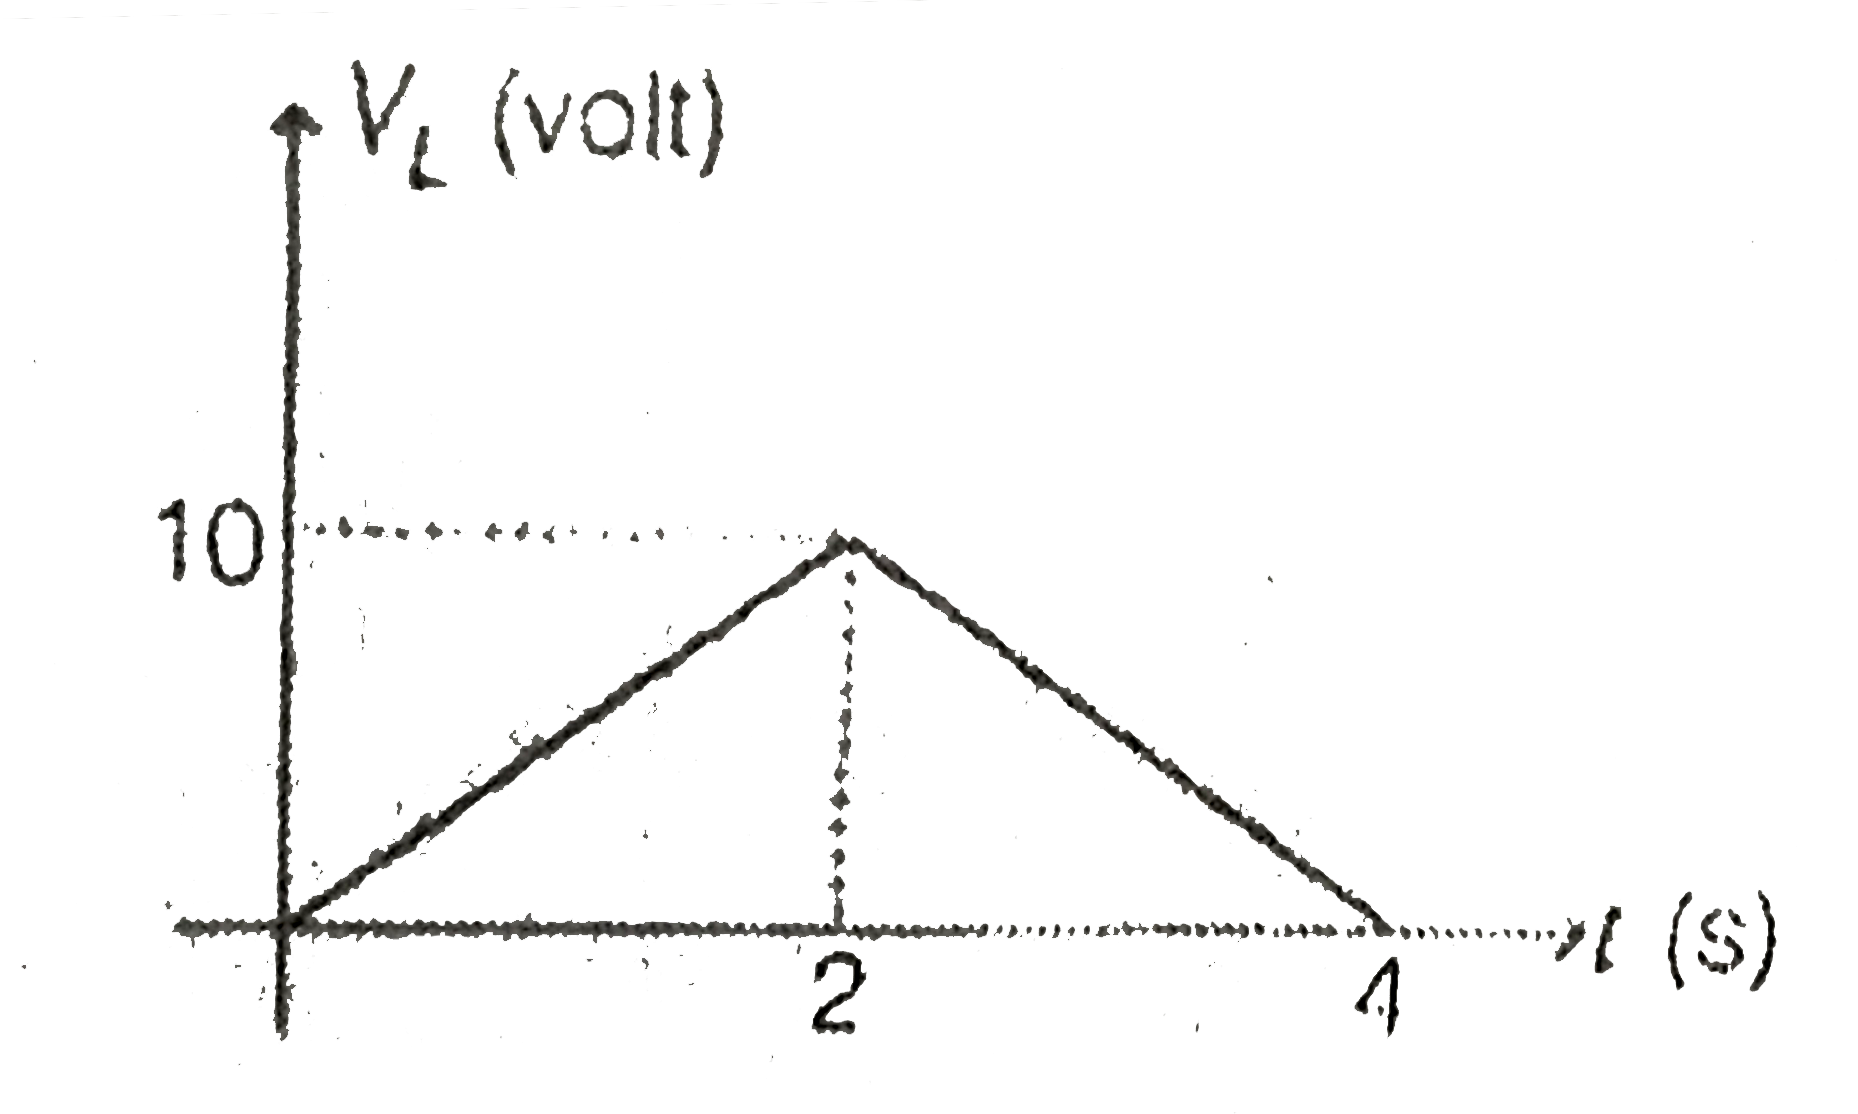
Current versus time graph across the inductor will be
View SolutionThe current i in an induction coil varies with time t according to the graph shown in the figure-5.250. Which of the following graphs shows the induced EMF in the coil with time ?
View SolutionThe current through a 4.6 H inductor is shown in the following graph. The induced emf during the time interval t = 5 milli - sec to 6 milli - sec will be

View SolutionCurrent l versus time t graph through a conductor is shown in the figure. Average current through the conductor in the interval 0 to 15 s is
View SolutionThe current I through a conductor varies with time t as shown in figure. The average electric current during t=0 to t=10 s will be

View Solution
