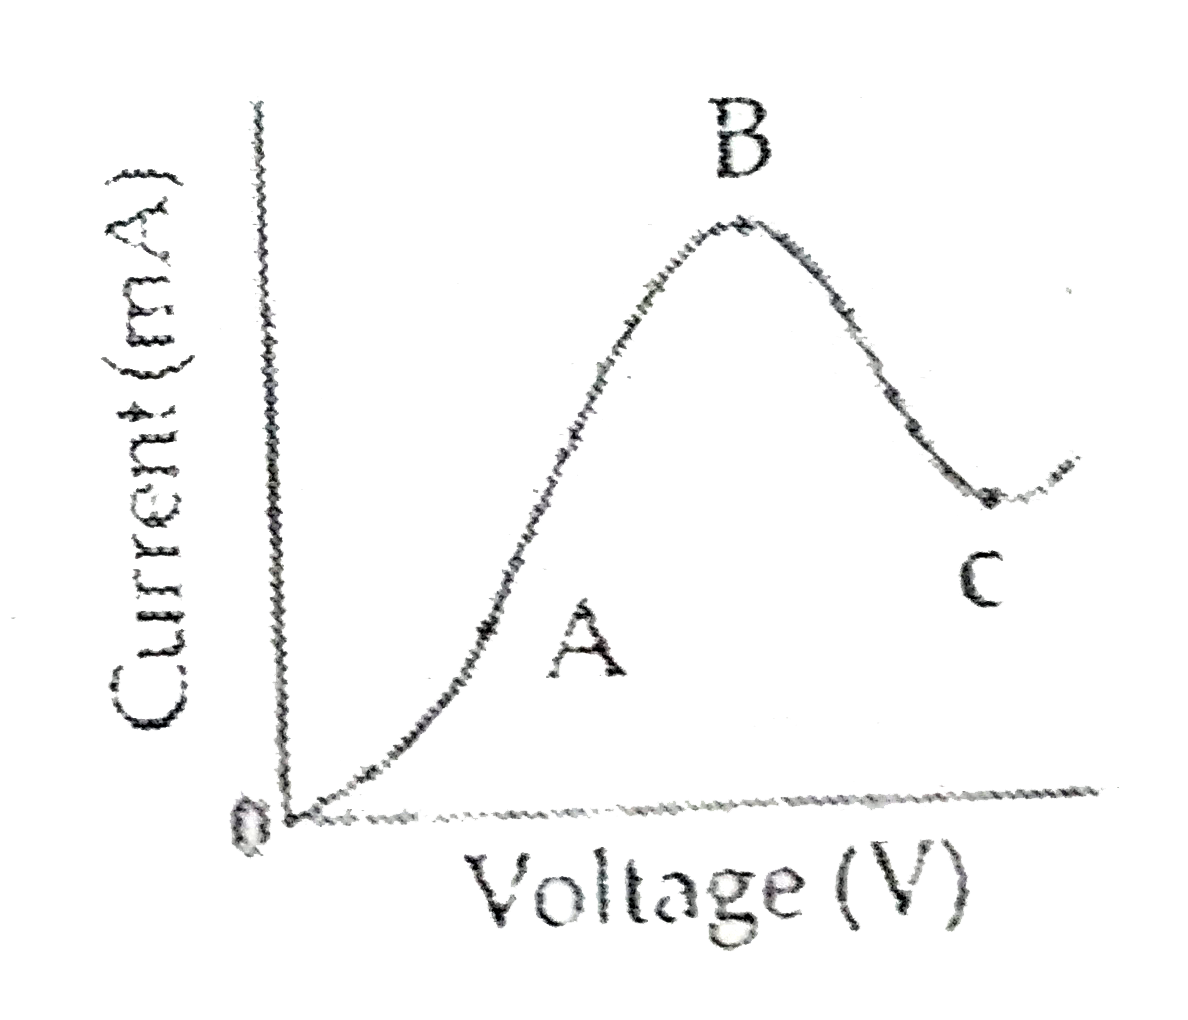
Given graph is drawn on the parameters of growth versus time. Here A,B and C respetively represent
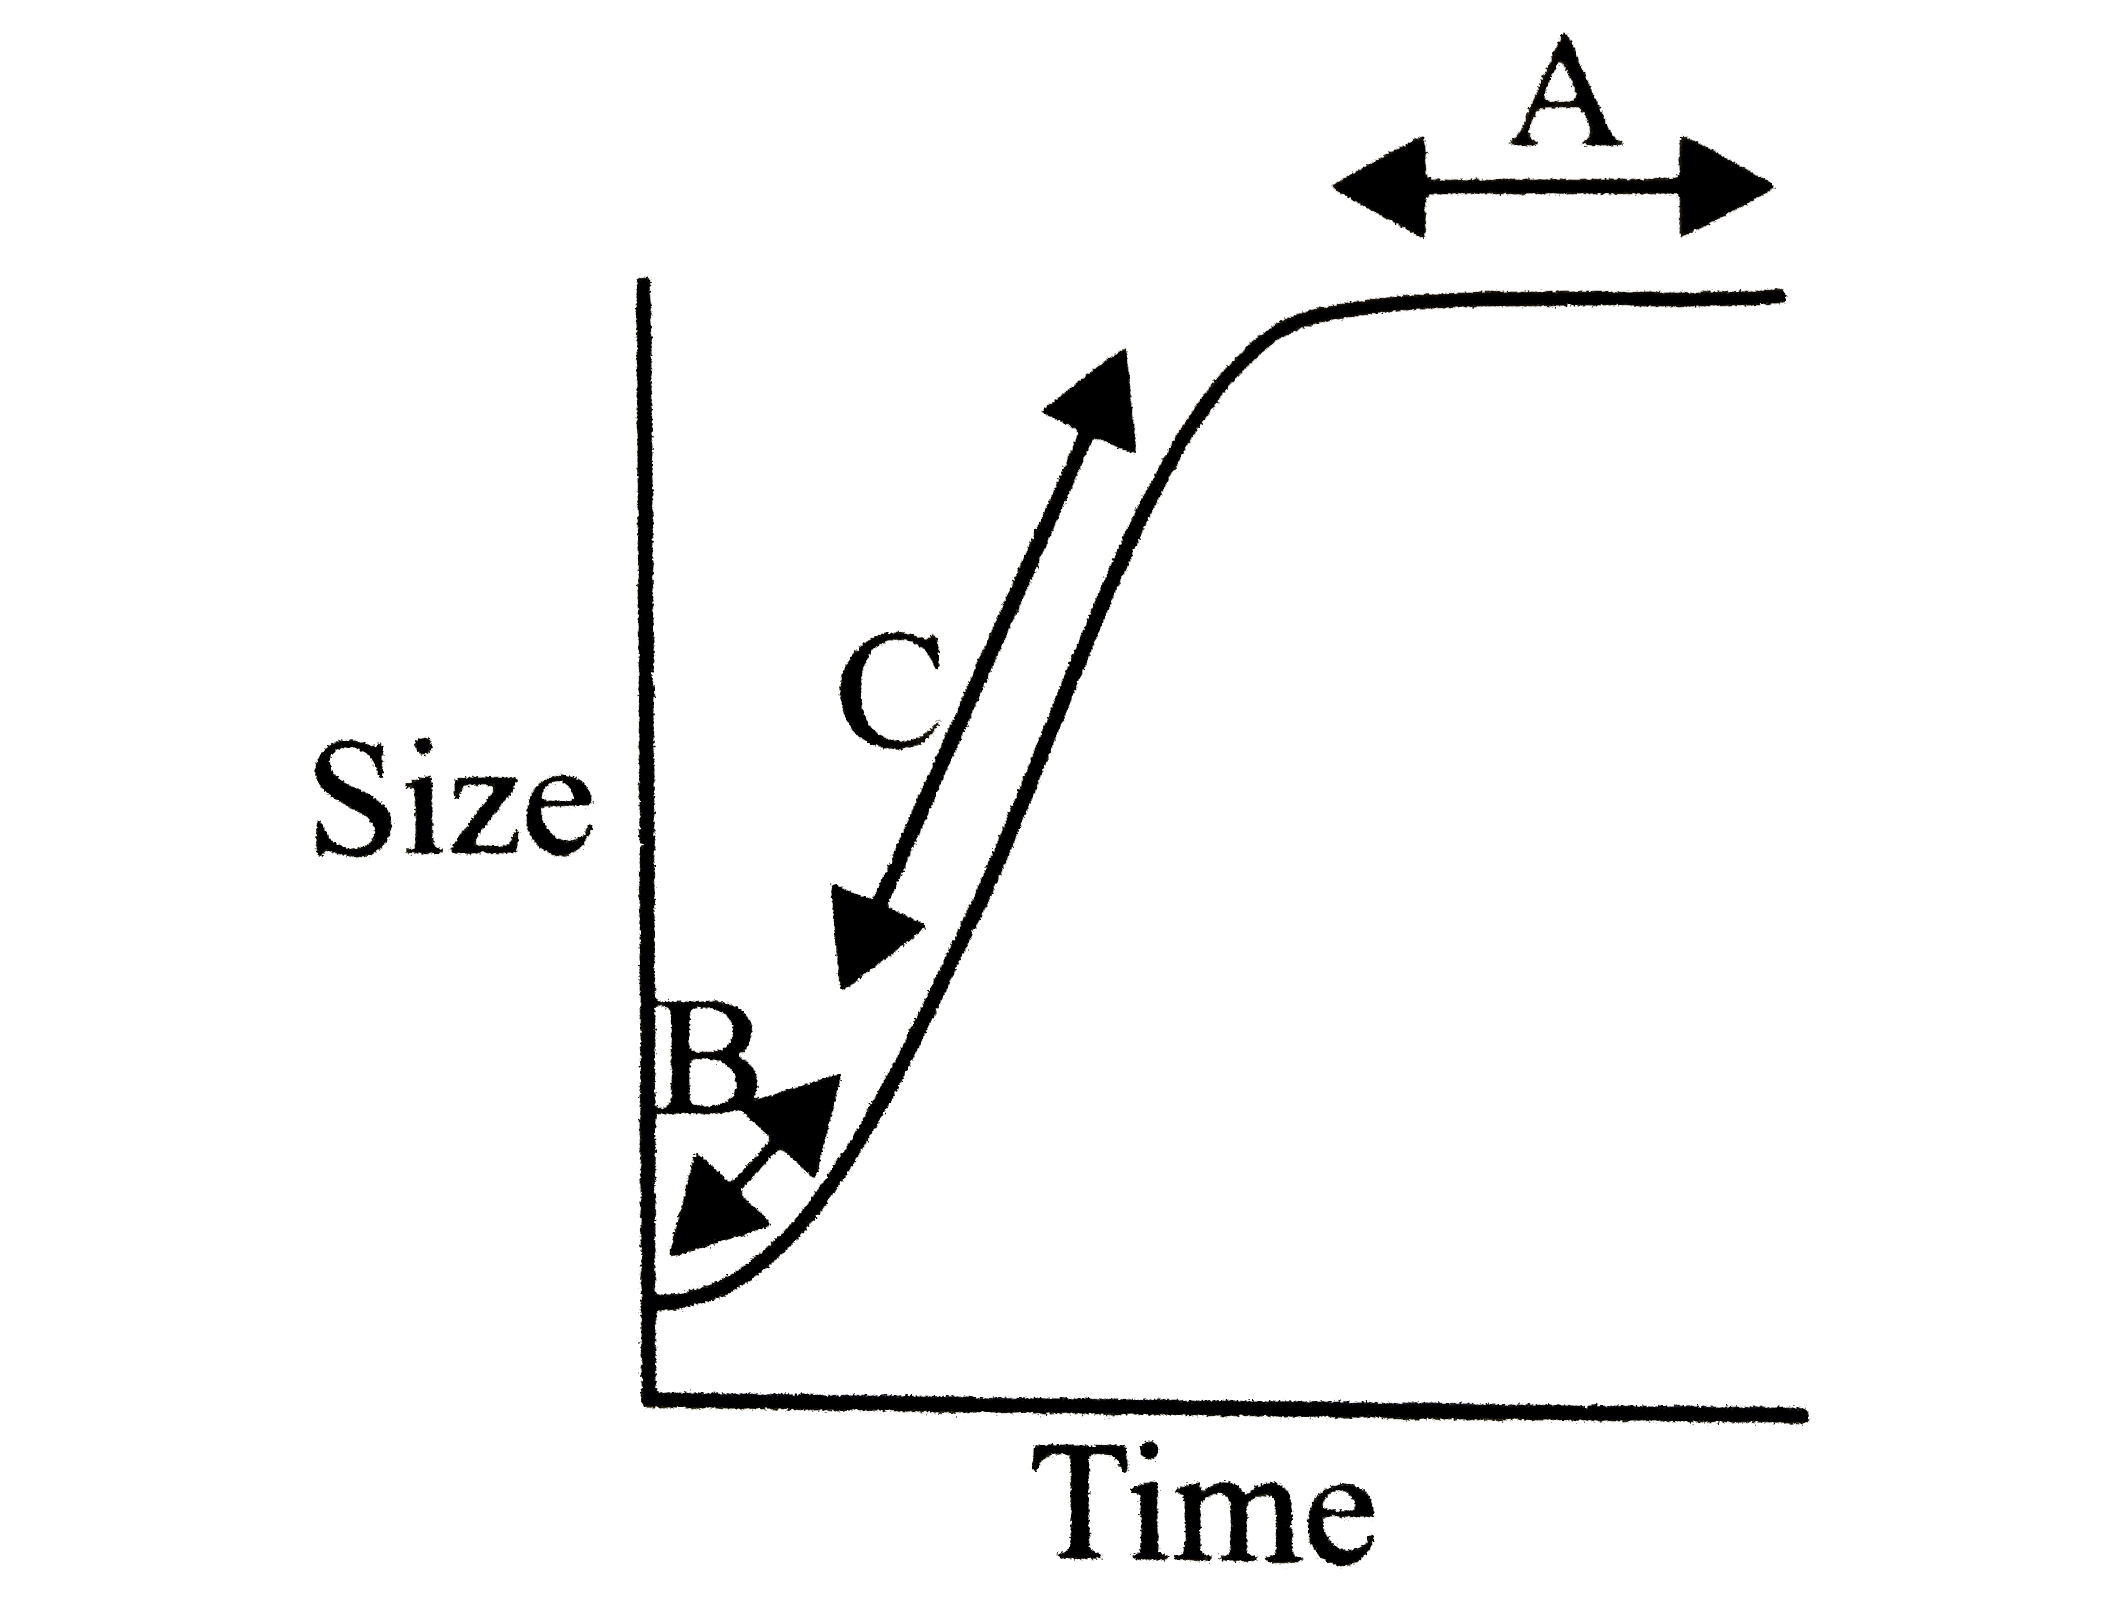
Exponential phase, lag phase and steady state phase
Steady state phase, lag phase and log phase
Slow growing phase, lag phase, steady state phase
Log phase lag phase and steady state phase.
The correct Answer is:B
Step by step video & image solution for Given graph is drawn on the parameters of growth versus time. Here A,B and C respetively represent by Biology experts to help you in doubts & scoring excellent marks in Class 12 exams.
Updated on:21/07/2023Topper's Solved these Questions
- Plant Growth and MovementsBOOK - DINESH PUBLICATION ENGLISHCHAPTER - Plant Growth and MovementsEXERCISE - CYG
20 Videos
- Plant Growth and MovementsBOOK - DINESH PUBLICATION ENGLISHCHAPTER - Plant Growth and MovementsEXERCISE - BRAIN TEASERS-IV
41 Videos
- Plant Growth and MovementsBOOK - DINESH PUBLICATION ENGLISHCHAPTER - Plant Growth and MovementsEXERCISE - BRAIN TEASERS-IV
41 Videos
- PLANT BREEDING AND DISEASE CONTROLBOOK - DINESH PUBLICATION ENGLISHCHAPTER - PLANT BREEDING AND DISEASE CONTROLEXERCISE - Check your Grasp
10 Videos
- PLATYHELMINTHES-THE FLAT WORMSBOOK - DINESH PUBLICATION ENGLISHCHAPTER - PLATYHELMINTHES-THE FLAT WORMSEXERCISE - check your grasp
9 Videos
Similar Questions
Knowledge Check
The given diagram shows axon terminal and synapse. Here A,B,C,D and E respectively represent
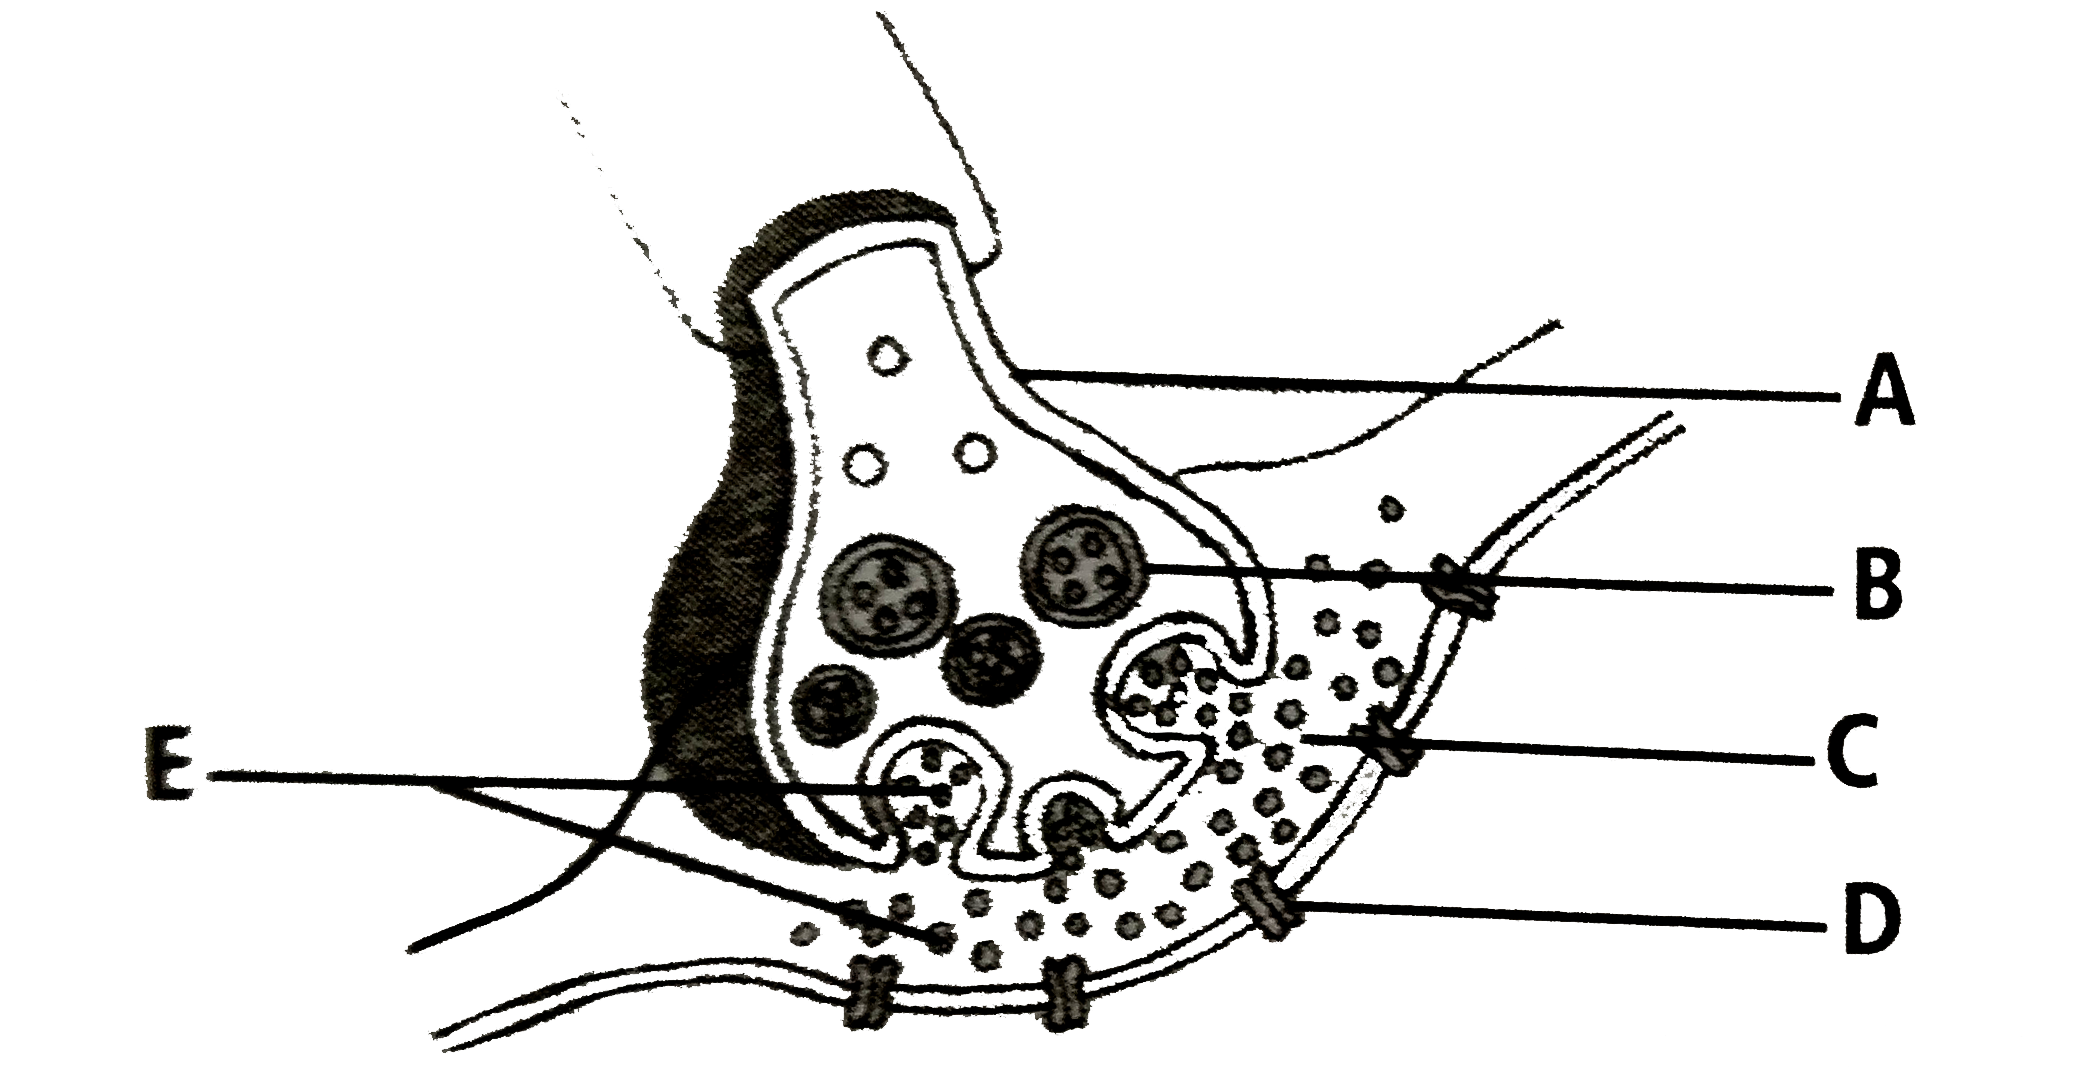 AAxon terminal, Synaptic cleft, Synaptic versicles, Neurotransmitters and ReceptorsBAxon terminal, Synaptic vesicles, Synaptic cleft, Receptors and NeurotransmittersCSynaptic cleft, Synaptic vesicles, Axon terminal, Neurotransmitters and ReceptorsDSynaptic cleft, Axon terminal, Synaptic vesicles, Neurotransmitters and Receptors
Plot a graph of terminnal velocity versus time.
View SolutionThe graph plotted between concentration versus time
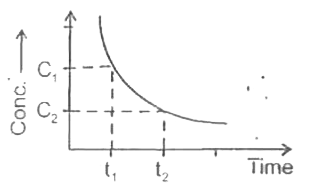
View SolutionThe plote between concentration versus time for a zero order reaction is represented by :
View Solution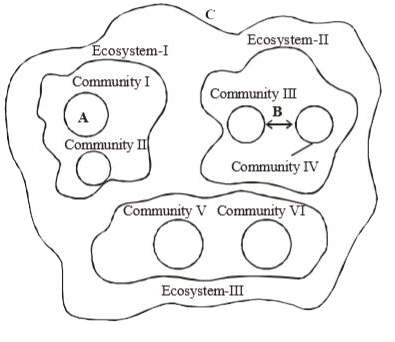
In the given diagram which diversity represent by A, B, and C
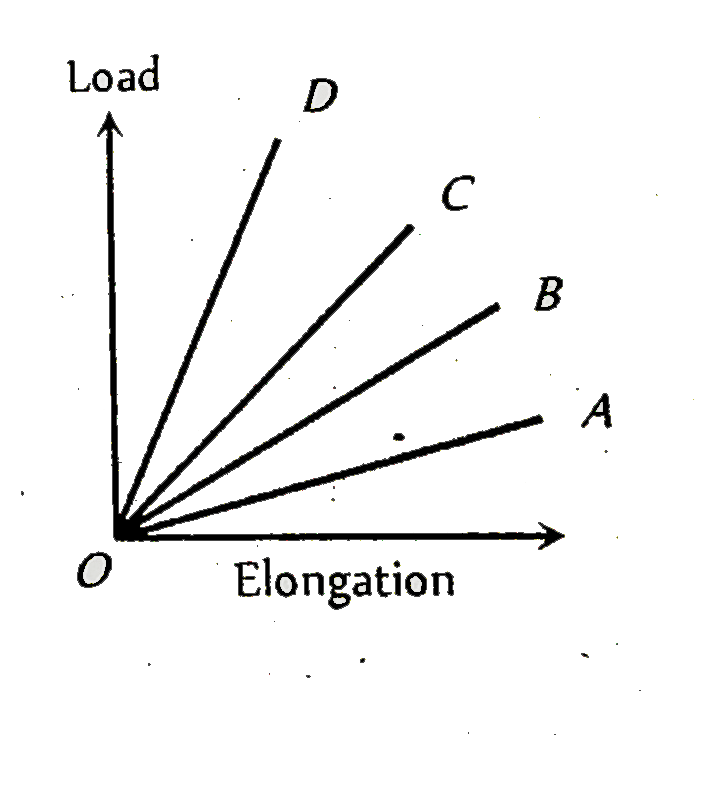
View SolutionThe load versus elongation graph for four wires of the same material is shown in the figure. The thickest wire is represented by
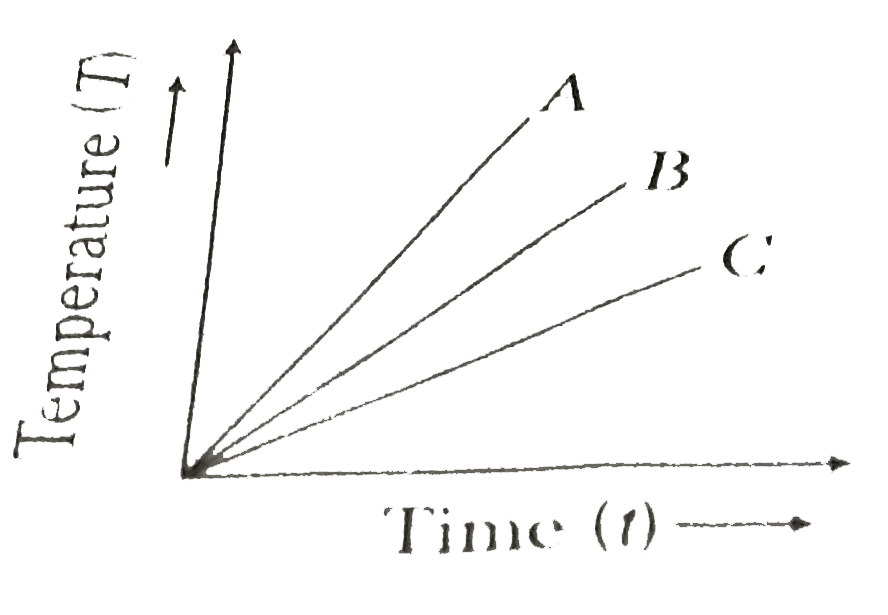
View SolutionThe temperatures versus time graph is shown in figure. Which of the substance A,B and C has the lowest heat capacity if heat is supplied to all of them at equal rates.
View SolutionThe graph shown in the figure represents a plot of current versus voltage for a given semi-conductor. Identify the region, if any, over which the semicondutor has a negative resistance.
View Solution

