Following table shows the number of bicycles manufactured in a factory during the years 1998 to 2002. Illustrate this data using a bar graph. Choose a scale of your choice.
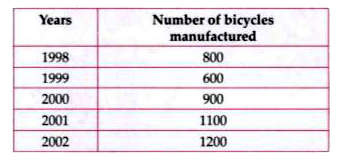
In which year were the maximum number of bicycles manufactured ?
Step by step video & image solution for Following table shows the number of bicycles manufactured in a factory during the years 1998 to 2002. Illustrate this data using a bar graph. Choose a scale of your choice. In which year were the maximum number of bicycles manufactured ? by Maths experts to help you in doubts & scoring excellent marks in Class 6 exams.
Updated on:21/07/2023Topper's Solved these Questions
- DATA HANDLING BOOK - MTG IIT JEE FOUNDATIONCHAPTER - DATA HANDLING EXERCISE - Exercise (Multiple Choice Questions) Level -1
35 Videos
- DATA HANDLING BOOK - MTG IIT JEE FOUNDATIONCHAPTER - DATA HANDLING EXERCISE - Exercise (Multiple Choice Questions) Level -2
16 Videos
- DATA HANDLING BOOK - MTG IIT JEE FOUNDATIONCHAPTER - DATA HANDLING EXERCISE - NCERT Section (Exercise 9.3)
11 Videos
- BASIC GEOMETRICAL IDEASBOOK - MTG IIT JEE FOUNDATIONCHAPTER - BASIC GEOMETRICAL IDEASEXERCISE - OLYMPIAD/HOTS CORNER
10 Videos
- DECIMALSBOOK - MTG IIT JEE FOUNDATIONCHAPTER - DECIMALSEXERCISE - OLYMPIAD/HOTS CORNER
20 Videos
Similar Questions
Following table shows the number of bicycles manufactured in a factory during the years 1998 to 2002. Illustrate this data using a bar graph. Choose a scale of your choice.
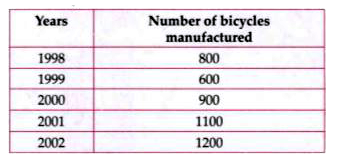
In which year were the minimum number of bicycles manufactured ?
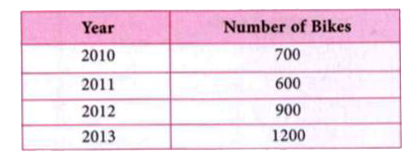
View SolutionDraw a bar graph using the data given in the following table, which shows the number of bikes manufactured in a factory during the years 2010 to 2013.
View Solution
Knowledge Check
Study the table carefully to answer the following questions ----
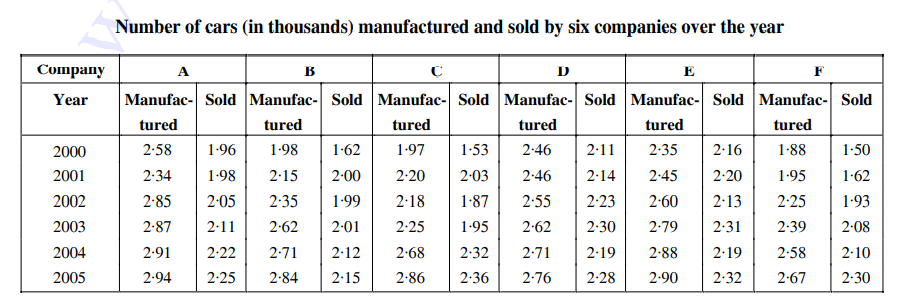
In which year were the maximum number of cars manufactured by all companies together ?A2001B2002C2003DNone of these
Number of wrist watches manufactured by a factory in six days of a particular week is given below.
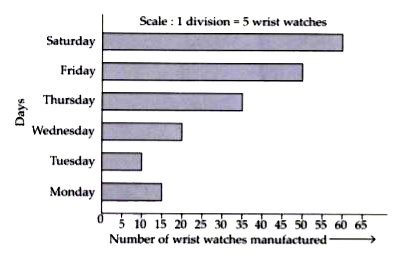
Read the bar graph and answer the following questions.
On which day, the minimum number of wrist watches were manufactured ?
View SolutionThe following table shows the number of fruits in a fruit shop. Represent the above data by a bar graph
View SolutionThe given bar graph shows the amount of wheat purchased by government during the year 1998-2002.
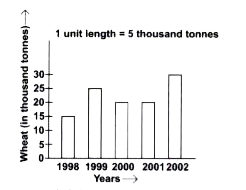
Read the bar graph and write down your observations. In which year was
the wheat production maximum ?
View SolutionThe given bar graph shows the amount of wheat purchased by government during the year 1998-2002.
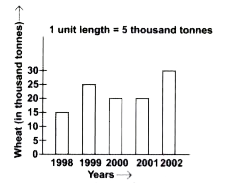
Read the bar graph and write down your observations. In which year was
the wheat production minimum ?
View SolutionThe following table gives the data of number of schools (stage-wise) of a country in the year 2002.
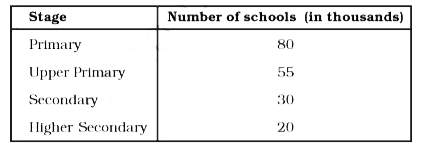
Draw a bar graph to represent the above data:
View SolutionNumber of wrist watches manufactured by a factory in six days of a particular week is given below.
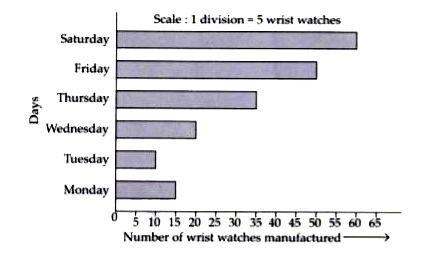
Read the bar graph and answer the following questions.
On which day, the maximum number of wrist watches were manufactured ? How many wrist watches were manufactured on that day ?
View SolutionThe pictograph shows the number of bicycles made by a factory during the four weeks of a month. Answer the following questions.
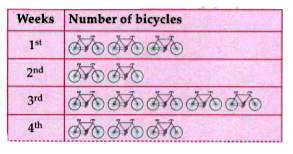

What is the difference between the number of bicycles made during 3rd week and 4th week ?
View Solution
