The figure below shows a circuit and its input voltage vi as function of time t.
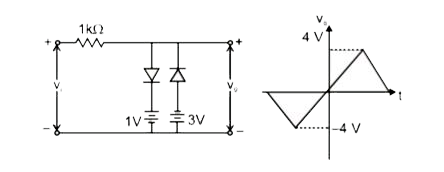
Assuming the diodes to be ideal, which of the following graphs depicts the output voltage v0 as function of time t ?
A
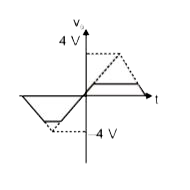
B
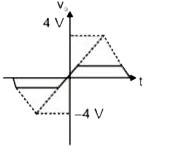
C
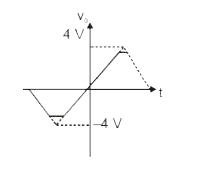
D
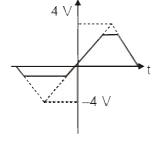
Text Solution
The correct Answer is:A
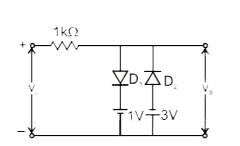
V0=Vi when no current flow through 1kΩ/ for negative value of Vi
iomD1=0 (always)
iomD2=0 upto 3V
So from 0 to -3V Vi=V0
from −3 to −4V V0=−3V
For positive value of Vi
iomD1=0 upto 1 V
iomD2=0 (always)
Hence 0 to 1 V Vi=V0
1 to 4 V V0=1 volt
Correct graph is (A)
|
Topper's Solved these Questions
- QUESTION PAPER 2013BOOK - KVPY PREVIOUS YEARCHAPTER - QUESTION PAPER 2013EXERCISE - PART-I ( PHYSICS)
20 Videos
- MOCK TEST 9BOOK - KVPY PREVIOUS YEARCHAPTER - MOCK TEST 9EXERCISE - EXERCISE
19 Videos
- QUESTION PAPER 2020BOOK - KVPY PREVIOUS YEARCHAPTER - QUESTION PAPER 2020EXERCISE - PART-I : PHYSICS
50 Videos
Similar Questions
Knowledge Check
In the circuit shown in figure the maximum output voltage V0 is
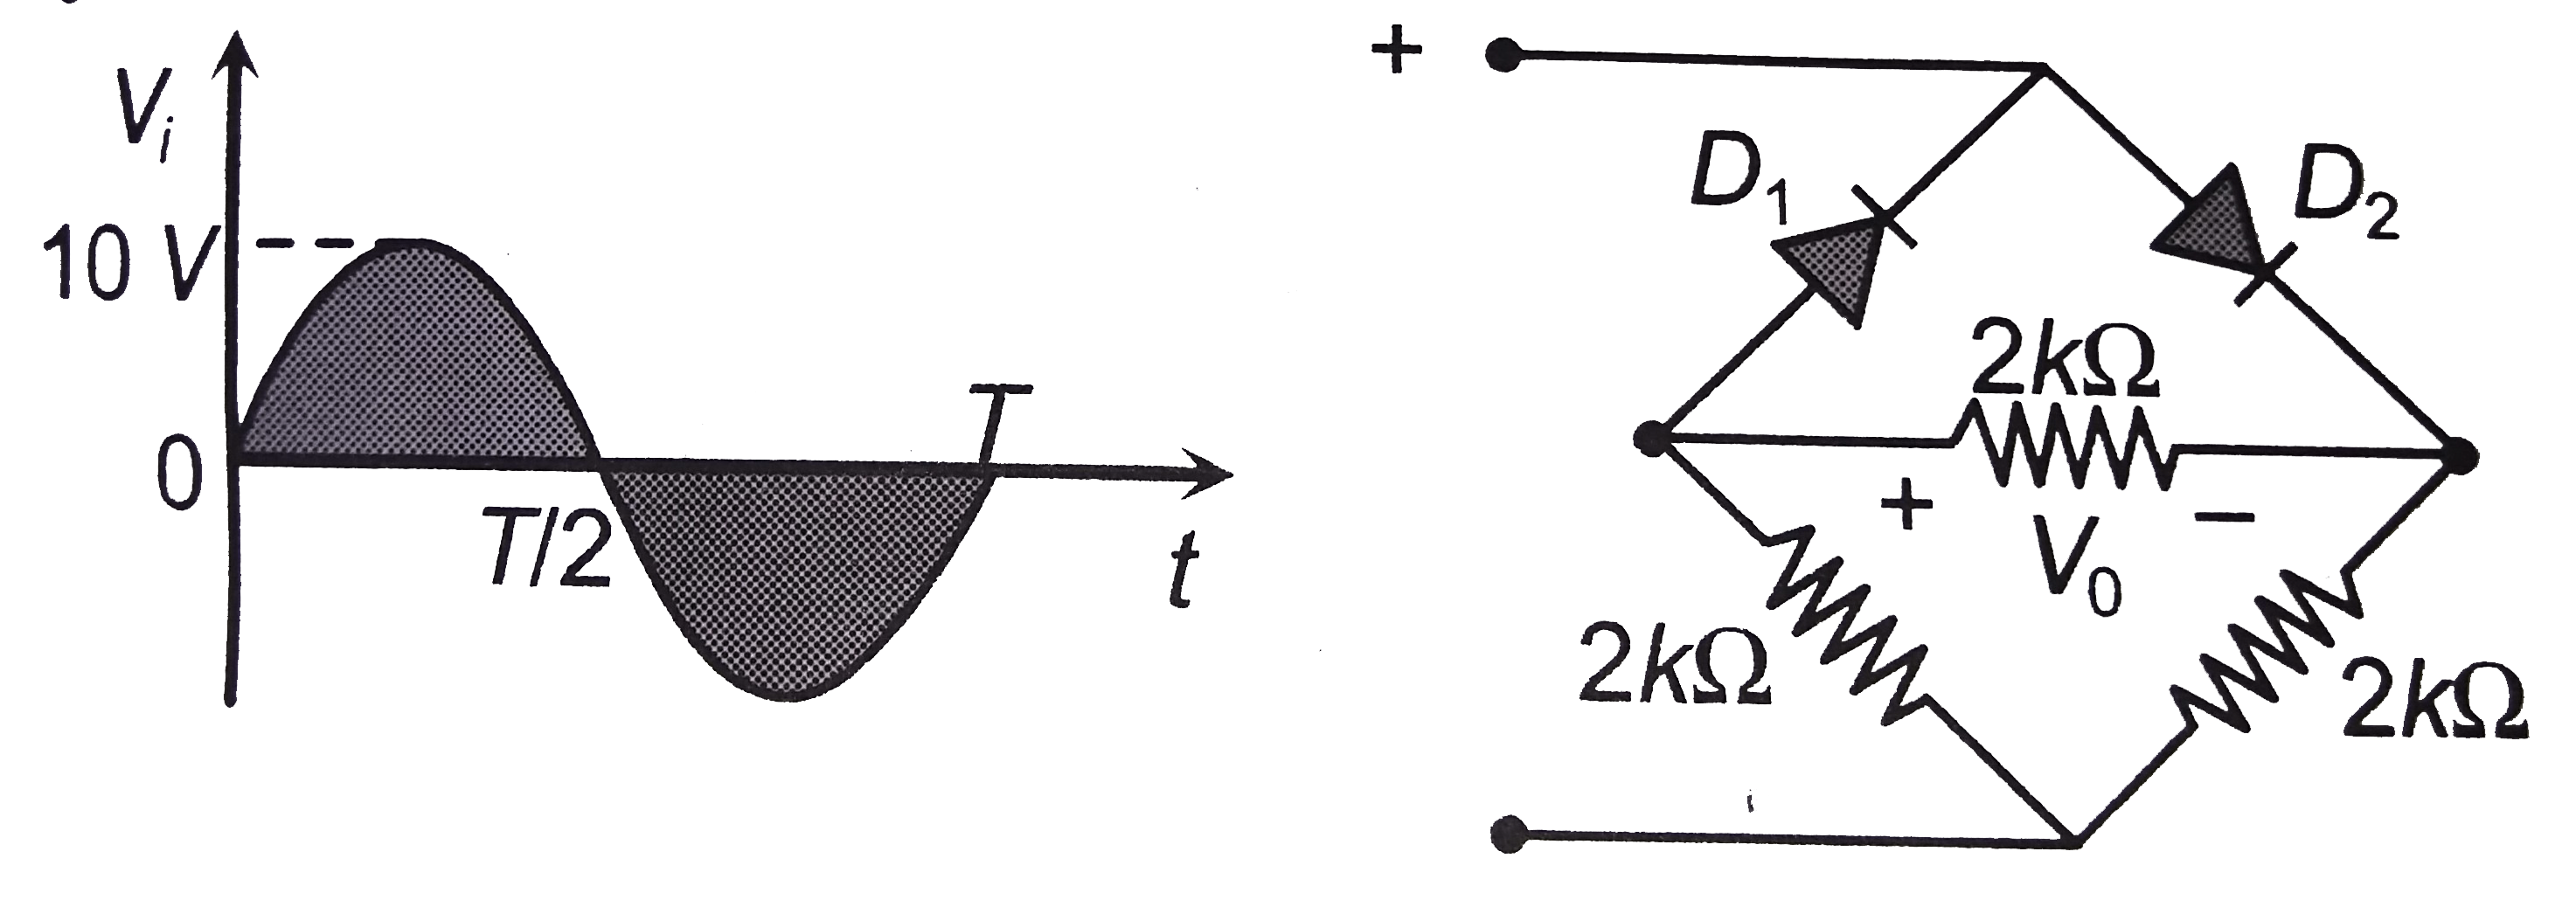 A0VB5VC10VD5√2V
An input voltage Vi of 0.20V is applied to an operational amplifier connected as shown in the diagram. What is the output voltage V0?
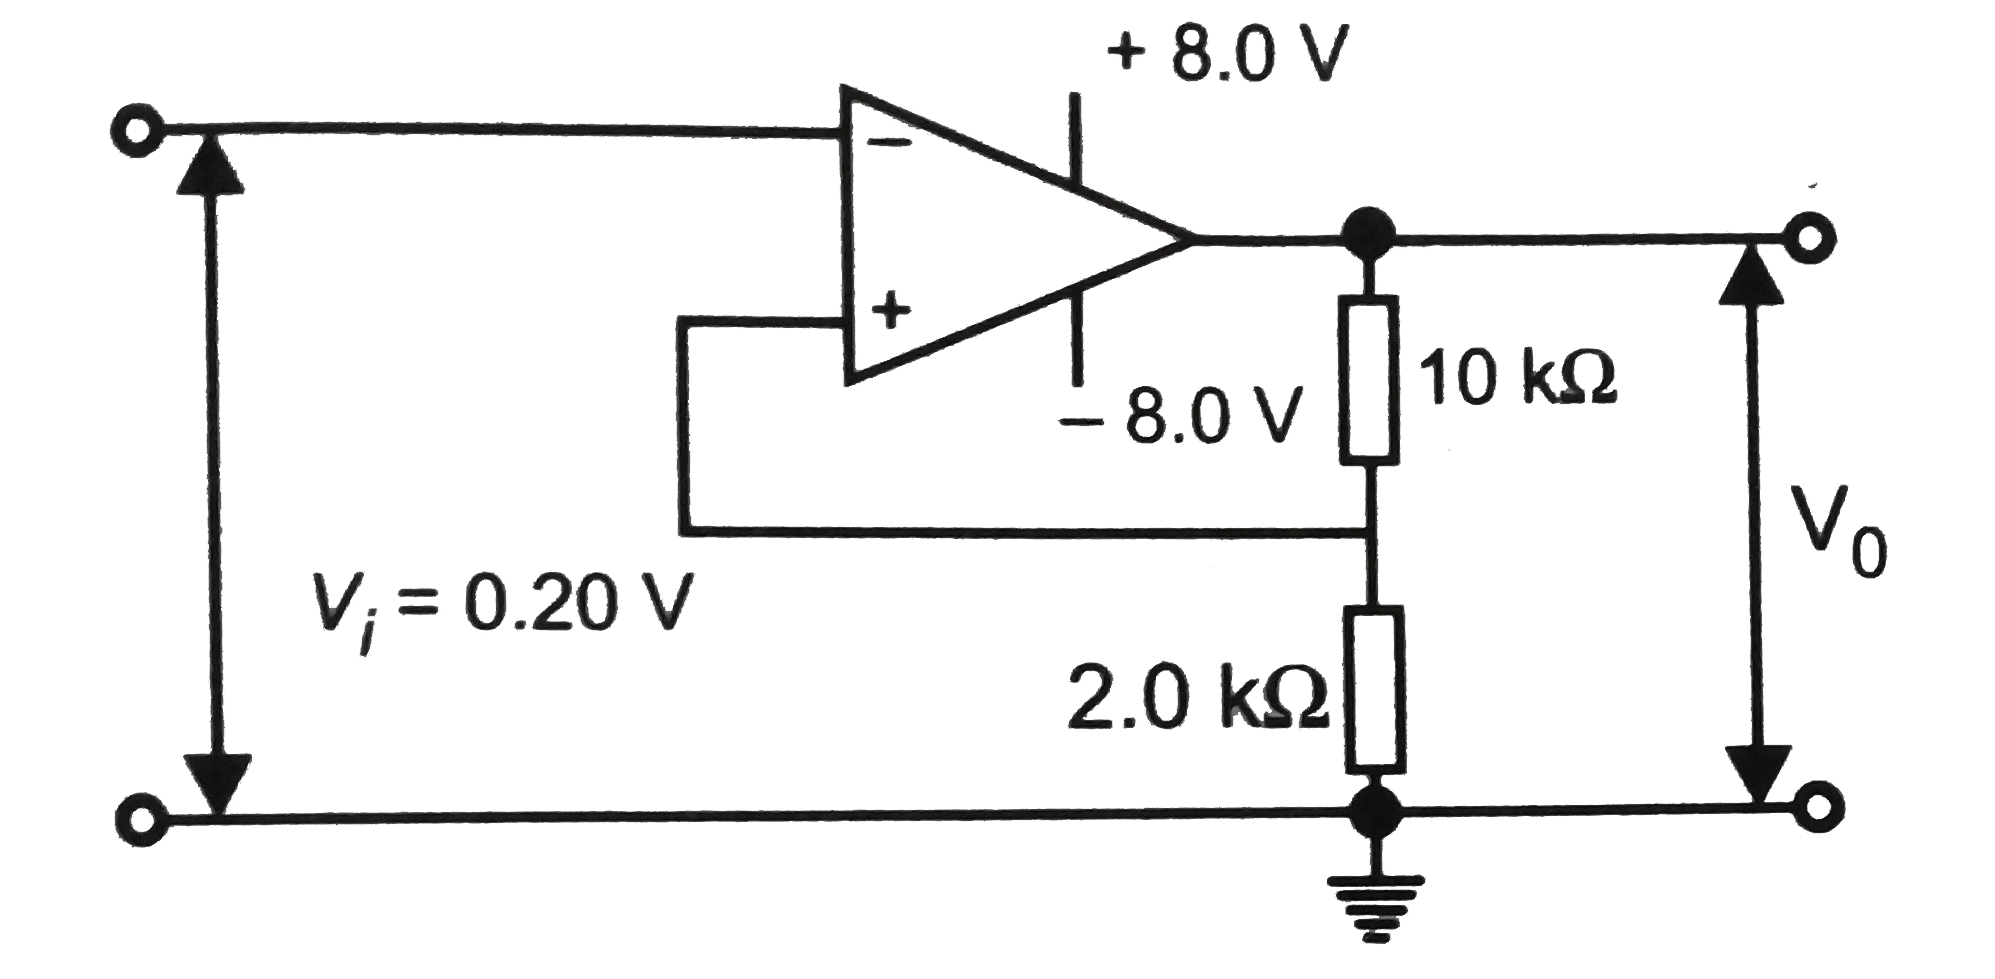 A0.20VB1.2VC0.80VD8.0V
If the input voltage Vi to the circuit below is given by Vi(t)=Acos(2πft), the output voltage is given by Vo(t)=Bcos(2πft+ϕ)-

Which one of the following four graphs best depict the variation of ϕ vs f ?A B
B C
C D
D
What is the value of output voltage V0 in the circuit shown in the figure ?
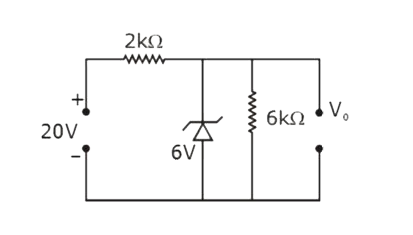
View SolutionWhat is the value of output voltage V0 in the circuit shown in the figure ?
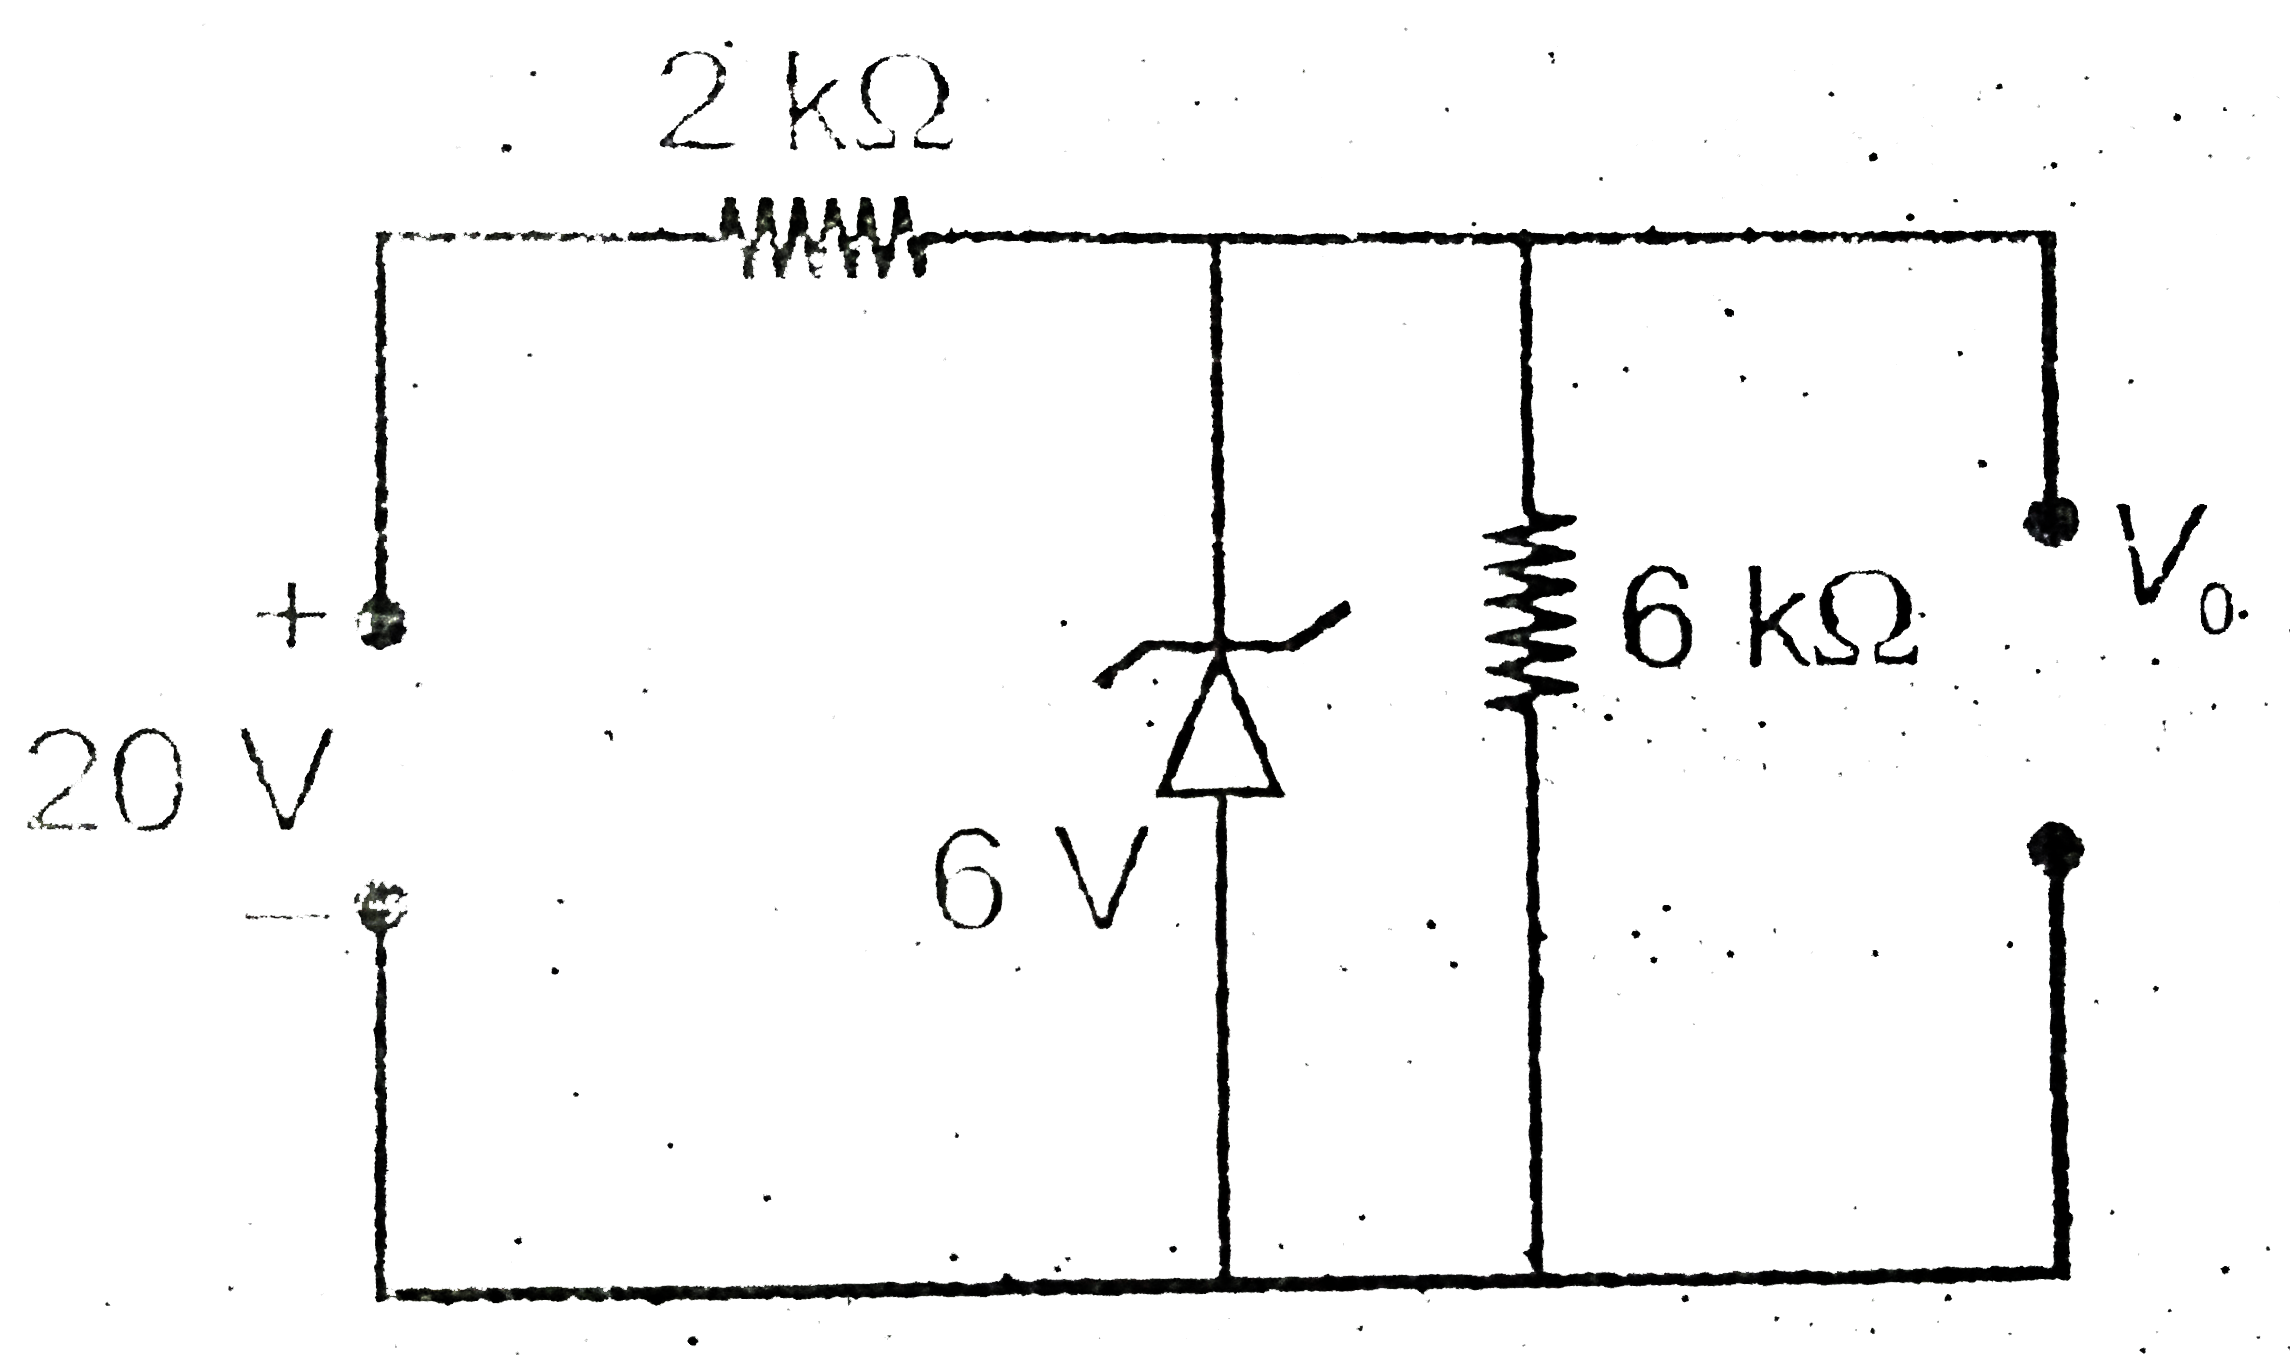
View SolutionWhat is the value of output voltage V0 in the circuit shown in the figure ?

View SolutionIn the figure, D is an ideal diode and an alternating voltage of peak value 10 volts si connected as input V1. Which of the following figures represents the correct waveform of output voltage V0 ?
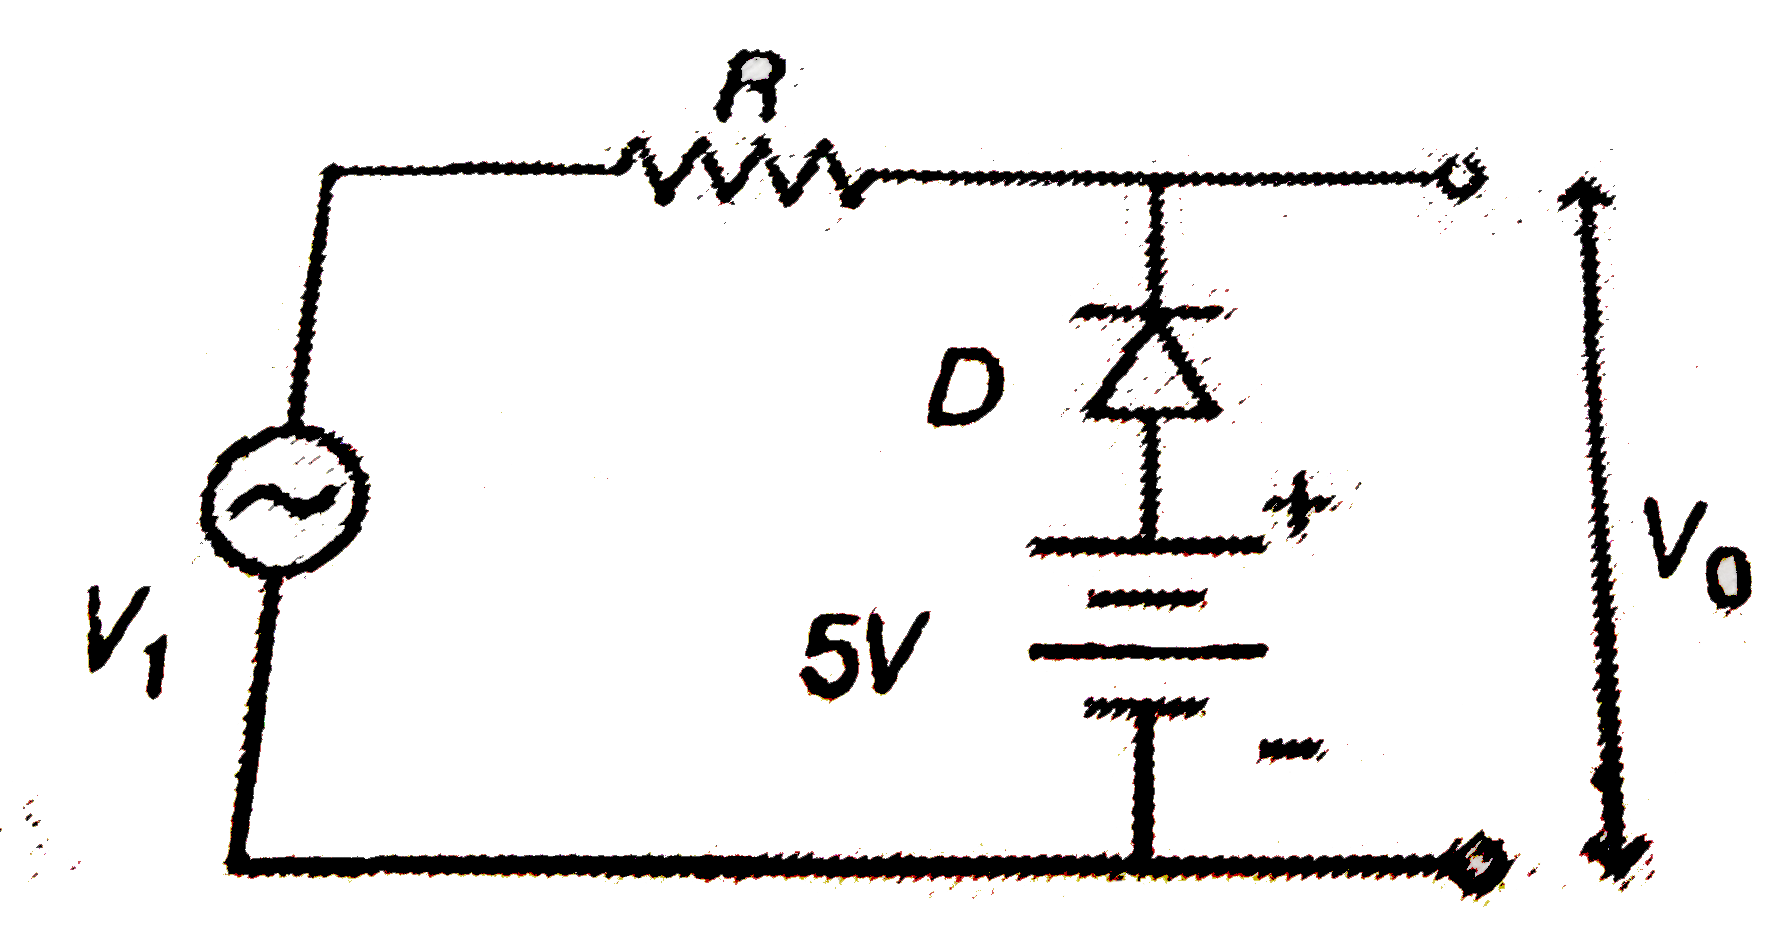
View SolutionFor a RLC series circuit , phasors of current i and applied voltage V=V0sinωt are shown in diagram at t=0, which of the following is/are CORRECT?
View Solution

