The line graph shows the production of product A and B during the period 2004 to 2009 and the second line graph shows the percentage sale of these products
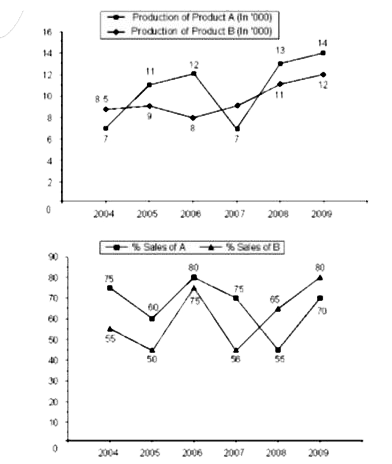
In the given line graph, what is the total sale of products A and B in the year 2007
10290
13460
11500
12490
The correct Answer is:C
Step by step video & image solution for The line graph shows the production of product A and B during the period 2004 to 2009 and the second line graph shows the percentage sale of these products In the given line graph, what is the total sale of products A and B in the year 2007 by Maths experts to help you in doubts & scoring excellent marks in Class 14 exams.
Updated on:21/07/2023Topper's Solved these Questions
Similar Questions
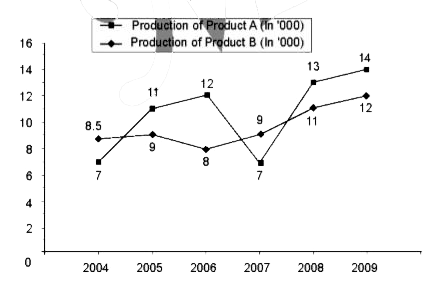
The line graph shows the production of product A and B during the period 2004 to 2009 and the second line graph shows the percentage sale of these products
 br>
br> 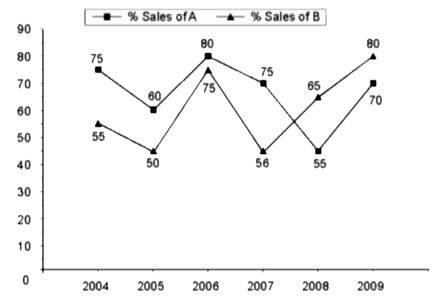
In the given line graph, what is the total sale of products A in the year 2005 and 2009 taken together?
View SolutionThe line graph shows the production of product A and B (in thousands) during the period 2004 to 2009 and the second line Graph shows the percentage sale of these products.
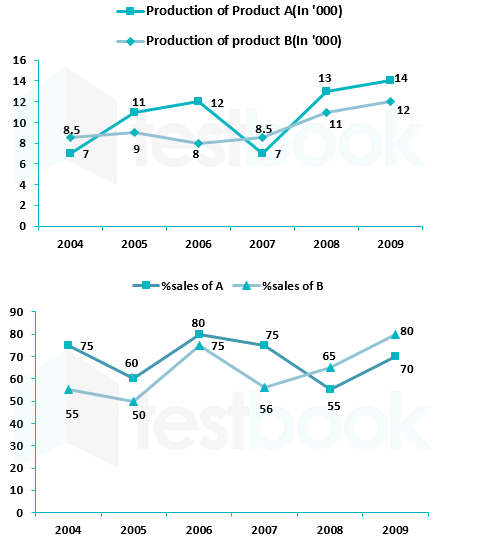
In the given line graph, what is the total sale of Products A and B in the year 2007?
View Solution
Knowledge Check
The given table represents the revenue (in ₹ crores) of a company from the sale of four products A,B,C and D in 6 years. Study the table carefully and answer the questions that follow.
दी गयी तालिका एक कंपनी को चार उत्पादों -A, B, C तथा D की बिक्री से 6 वर्षों में होने वाली आय ( करोड़ रुपये में ) को दर्शाती है | इस तालिका का ध्यानपूर्वक अध्ययन करें तथा फिर पूछे गए प्रश्नों का उत्तर दें The total revenue of the company from the sale of products B,C and D in 2014 is what percentage of
the total revenue from the sale of products C and D in 6 years?
2014 में उत्पाद B, C और D की बिक्री से कंपनी को हुई कुल आय 6 वर्षों में उत्पाद C और D की बिक्री से हुई कुल आय का कितना प्रतिशत है?A18B20C25D28The graph shows the production of food grains of a country in different years. Study the graph and answer the questions.
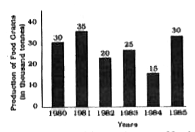
The percentage increase in production from 1984 to 1985 wasA15B30C50D100The following graph shows the production of cotton cloth (in lakh metres) by three companies A, B and C over the years.
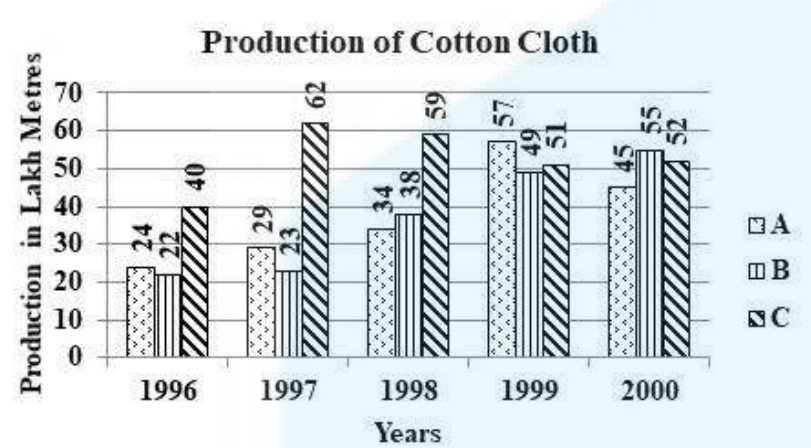
What is the ratio of the production of Company C in the years 1996 and 1997 to the production of Company B in the years 1999 and 2000?A3:11B51:52C11:3D52:51
The line graph shows the production of product A and B (in thousands) during the period 2004 to 2009 and the second line Graph shows the percentage sale of these products.

In the given line graph, what is the total sale of Product B in the year 2004 and 2008 together?
View SolutionThe line graph shows the production of product A and B (in thousands) during the period 2004 to 2009 and the second line Graph shows the percentage sale of these products.

In the given line graph. what is the total sale of Product A in the year 2005 and 2009 taken together?
View SolutionThe line graph shows the production of product A and B (in thousands) during the period 2004 to 2009 and the second line Graph shows the percentage sale of these products.
यह पंक्ति आलेख 2004 से 2009 की अवधि के दौरान वस्तु A एवं B के उत्पादन ( हज़ार में ) को दर्शाता है तथा दूसरा पंक्ति आलेख इन वस्तुओं की प्रतिशत बिक्री को दर्शाता है |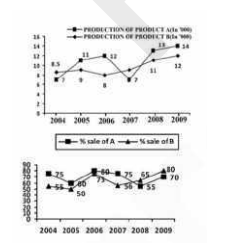 In the given line graph, what is the total sale of Product B in the year 2004 and 2008 together?
दिए गए पंक्ति आलेख के अनुसार, वर्ष 2004 एवं 2008 को मिलाकर वस्तु B की कुल बिक्री ज्ञात करें |
View SolutionThe line graph shows the production of product A and B (in thousands) during the period 2004 to 2009 and the second line Graph shows the percentage sale of these products.
यह पंक्ति आलेख 2004 से 2009 की अवधि के दौरान वस्तु A एवं B के उत्पादन ( हज़ार में ) को दर्शाता है तथा दूसरा पंक्ति आलेख इन वस्तुओं की प्रतिशत बिक्री को दर्शाता है |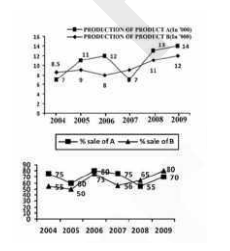 In the given line graph, what is the total sale of Product A in the year 2005 and 2009 taken together?
दिए गए पंक्ति आलेख के अनुसार, वर्ष 2005 तथा 2009 को मिलाकर वस्तु A की कुल बिक्री कितनी है ?
View SolutionReading of line graphs containing the production and sales of a company in a period
View Solution
