Answer the following questions:
The changes in the velocity of a car in specific time intervals are given in the following table.
The velocty-time graph in figure shows that,
For nonuniformly accelerated motions, the velocity-time graph may have any shape depending on how the acceleration changes with time.Explain.
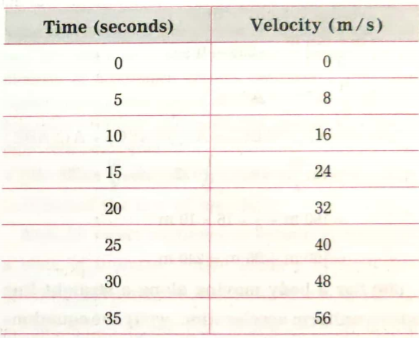
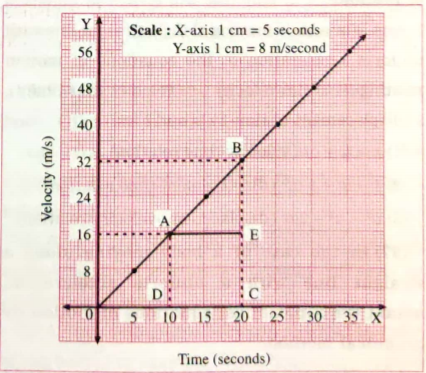 Solution in Marathi
Step by step video & image solution for Answer the following questions: The changes in the velocity of a car in specific time intervals are given in the following table.The velocty-time graph in figure shows that, For nonuniformly accelerated motions, the velocity-time graph may have any shape depending on how the acceleration changes with time.Explain. by Physics experts to help you in doubts & scoring excellent marks in Class 9 exams.
Updated on:21/07/2023Topper's Solved these Questions
- LAWS OF MOTIONBOOK - NAVNEET PUBLICATIONCHAPTER - LAWS OF MOTIONEXERCISE - EXERCISE
196 Videos
- CURRENT ELECTRICITYBOOK - NAVNEET PUBLICATIONCHAPTER - CURRENT ELECTRICITYEXERCISE - EXERCISE
215 Videos
- MEASUREMENT OF MATTERBOOK - NAVNEET PUBLICATIONCHAPTER - MEASUREMENT OF MATTEREXERCISE - EXAMPLES
1 Videos
Similar Questions
Complete the sentences and explain them:
The minimum distance between the start and finish points of the motion of an object is called the ........ of the object.
View SolutionFill in the blanks:
The coulomb is the SI unit of………….
View SolutionWhat is the Dalton's atomic theory?
View SolutionDraw displacement time and acceleration -time graph for the given velocity-time graph
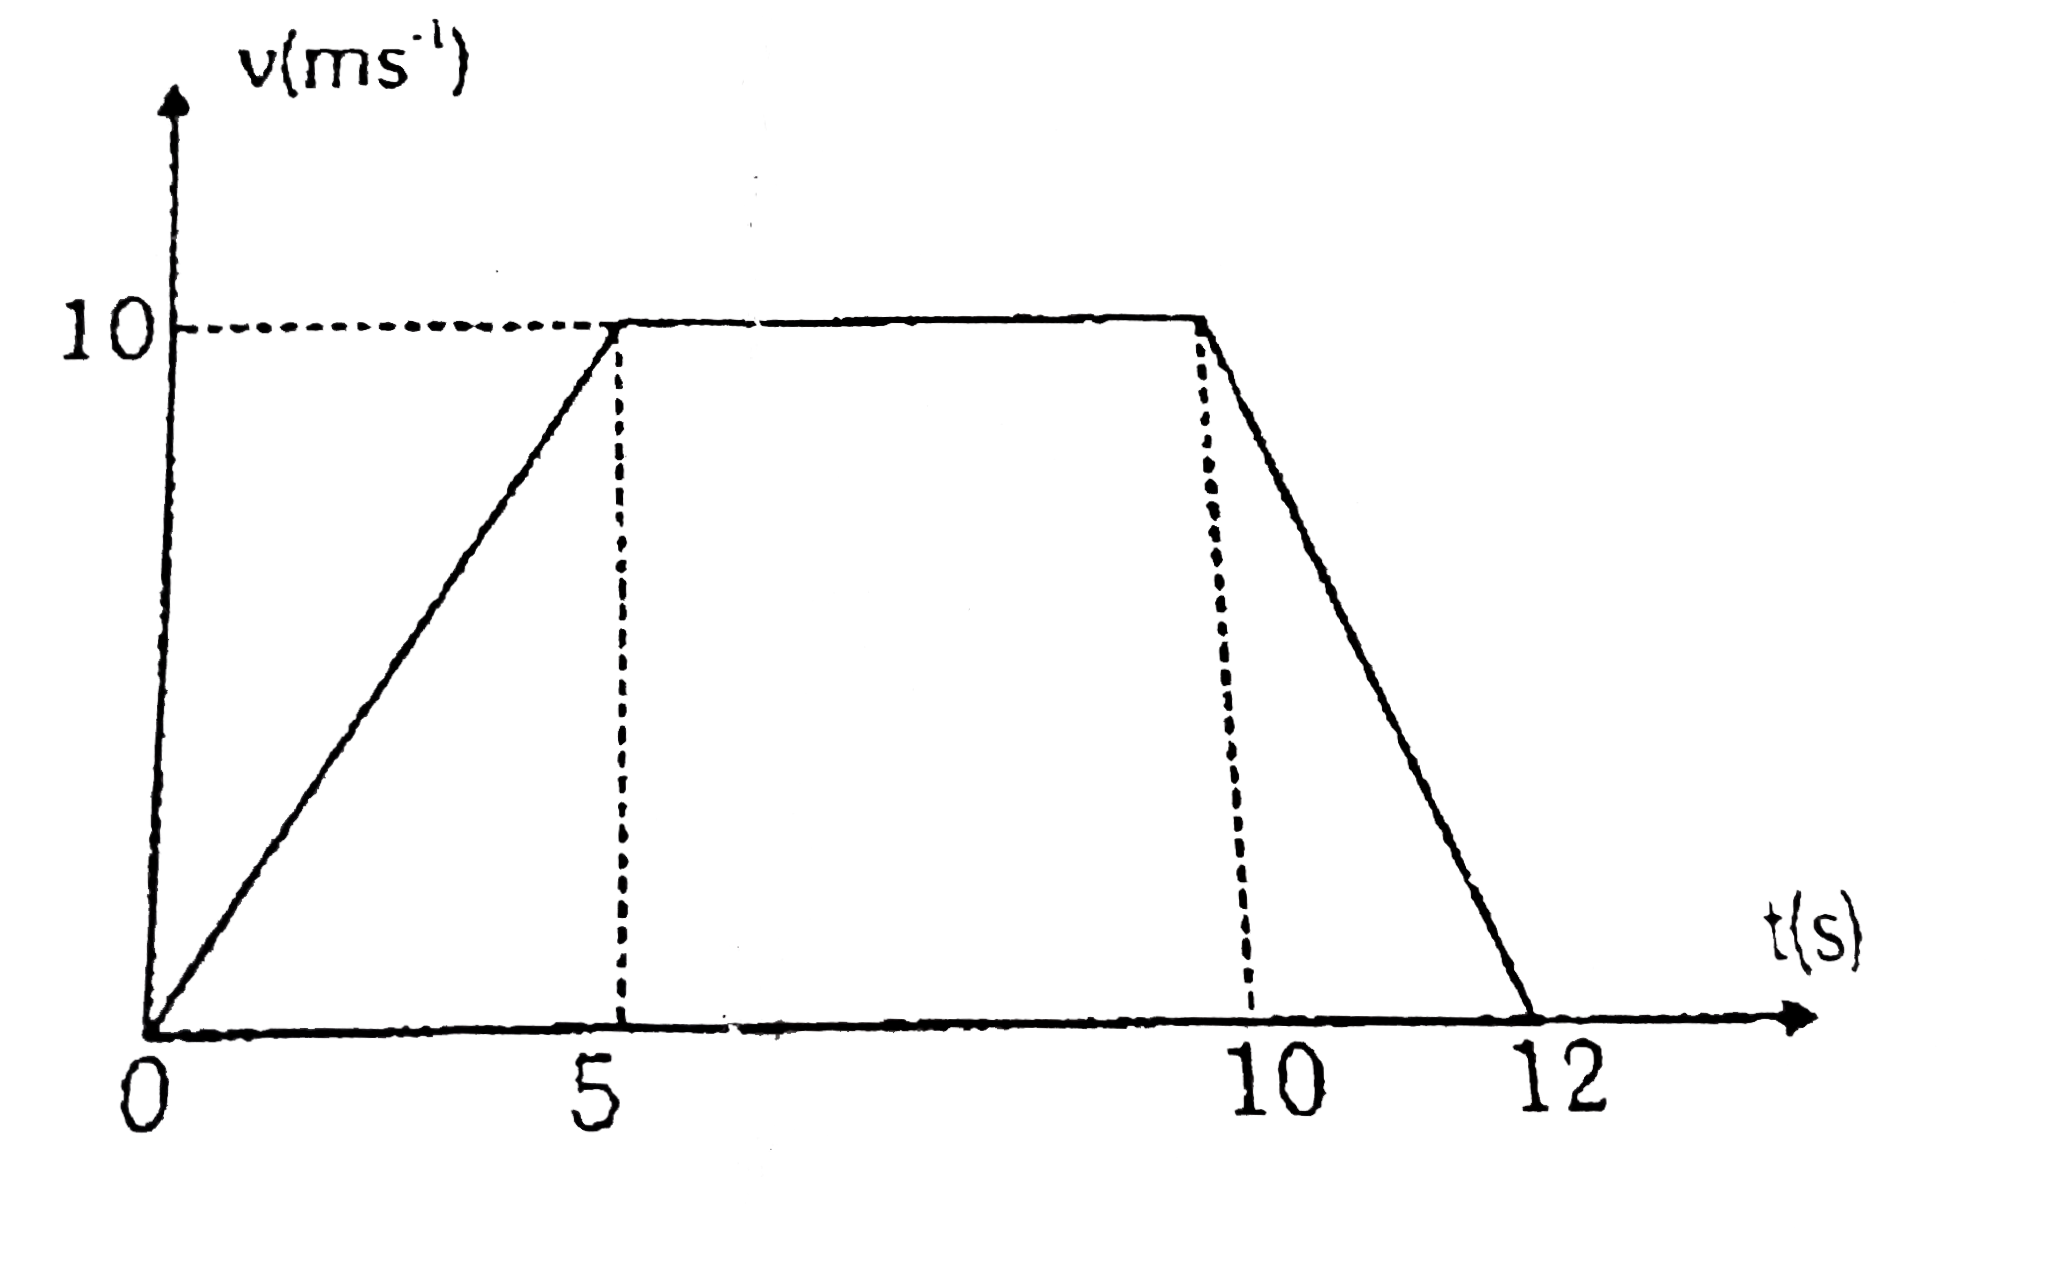
View SolutionThe velocity- time graph of car moving on a straight track is given below. The car weight 1000kg.
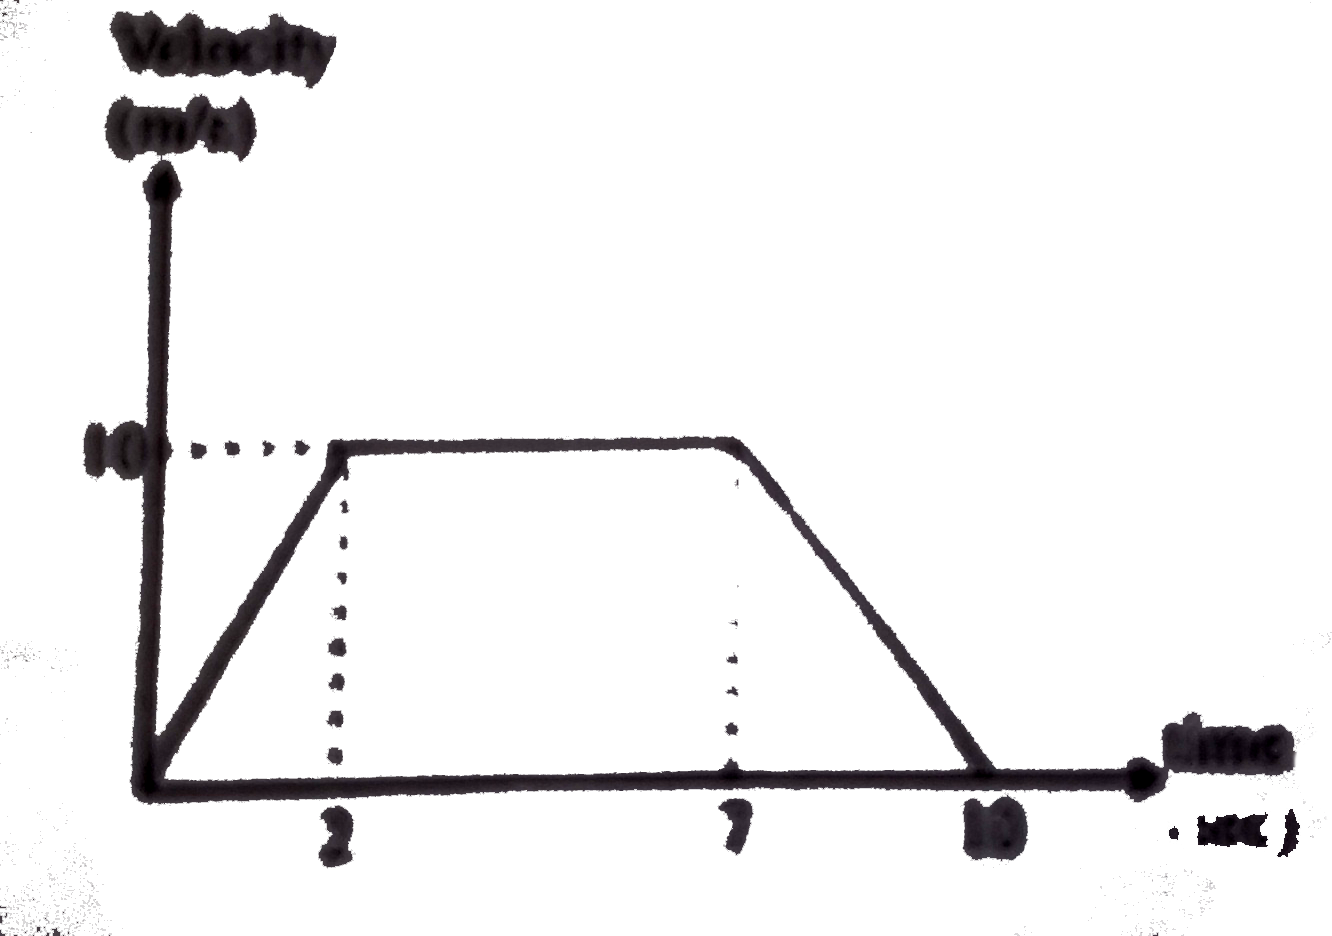 correct acceleration-time graph representing the motion of car is:
View SolutionGraphs are very useful to represent a physical situation. Various quantities can be easily represented on graphs and other quantites can be determined from the graph. For example the slope of velocity-time graph represents instantaneous acceleration. For a motion with constant acceleration slope of velocity-time graph is constant. If acceleration is changing with time, slope with change and thus velocity-time graph will be a non-linear curve. Further the area of velocity-time graph gives displacement.
The velocity-time graph for two objects P and Q are shown. The ratio of their respective acceleration is
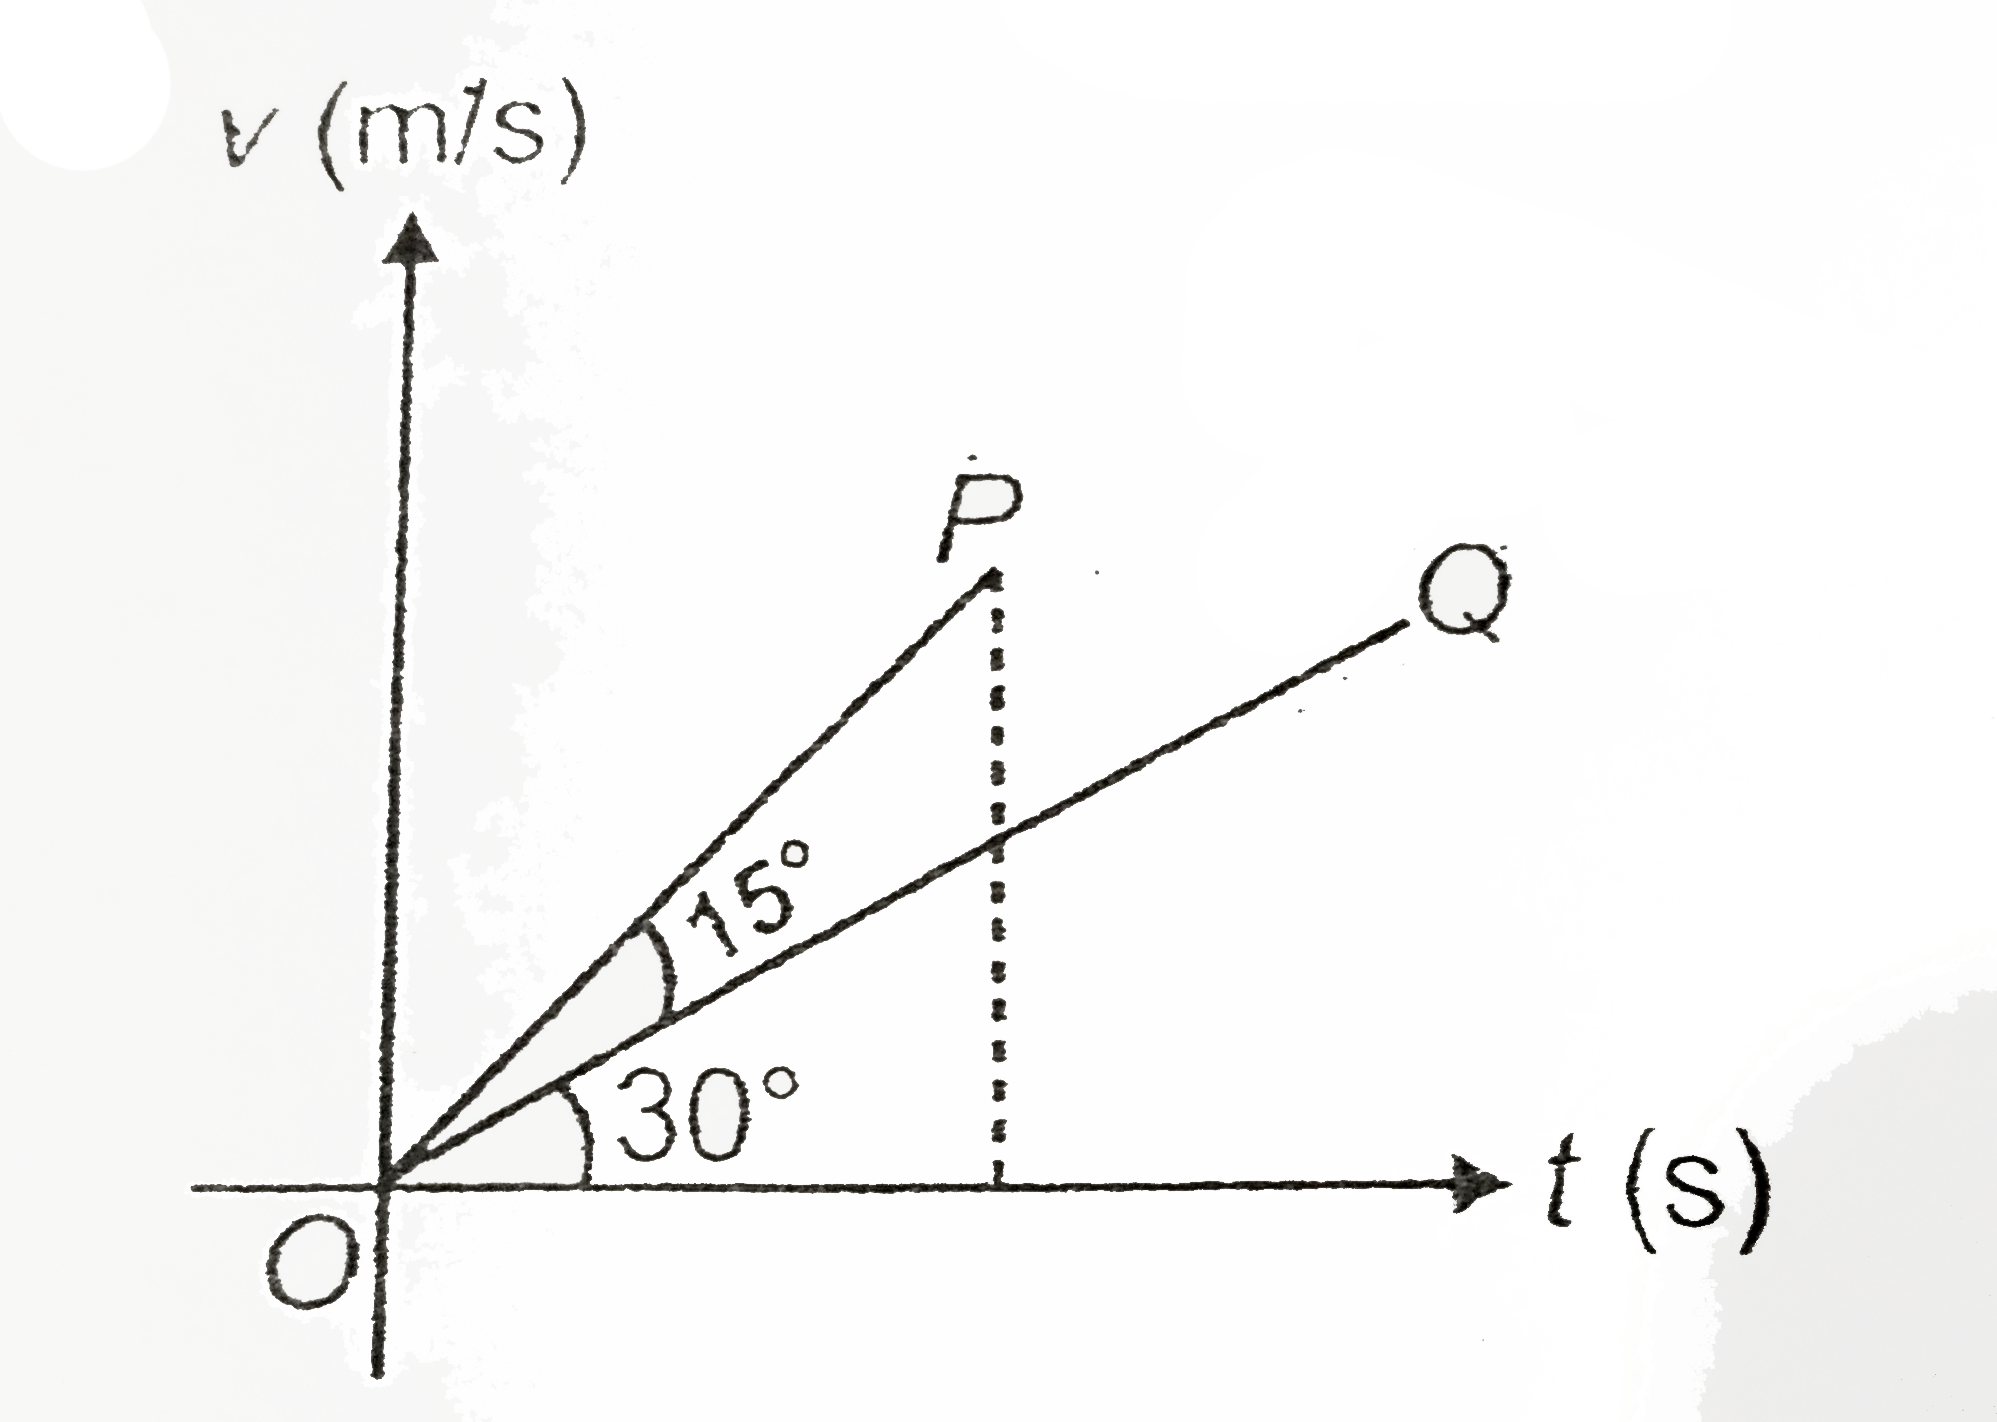
View SolutionGraphs are very useful to represent a physical situation. Various quantities can be easily represented on graphs and other quantites can be determined from the graph. For example the slope of velocity-time graph represents instantaneous acceleration. For a motion with constant acceleration slope of velocity-time graph is constant. If acceleration is changing with time, slope with change and thus velocity-time graph will be a non-linear curve. Further the area of velocity-time graph gives displacement.
For the given velocity-time graph the possibly correct acceleration-time relationship is
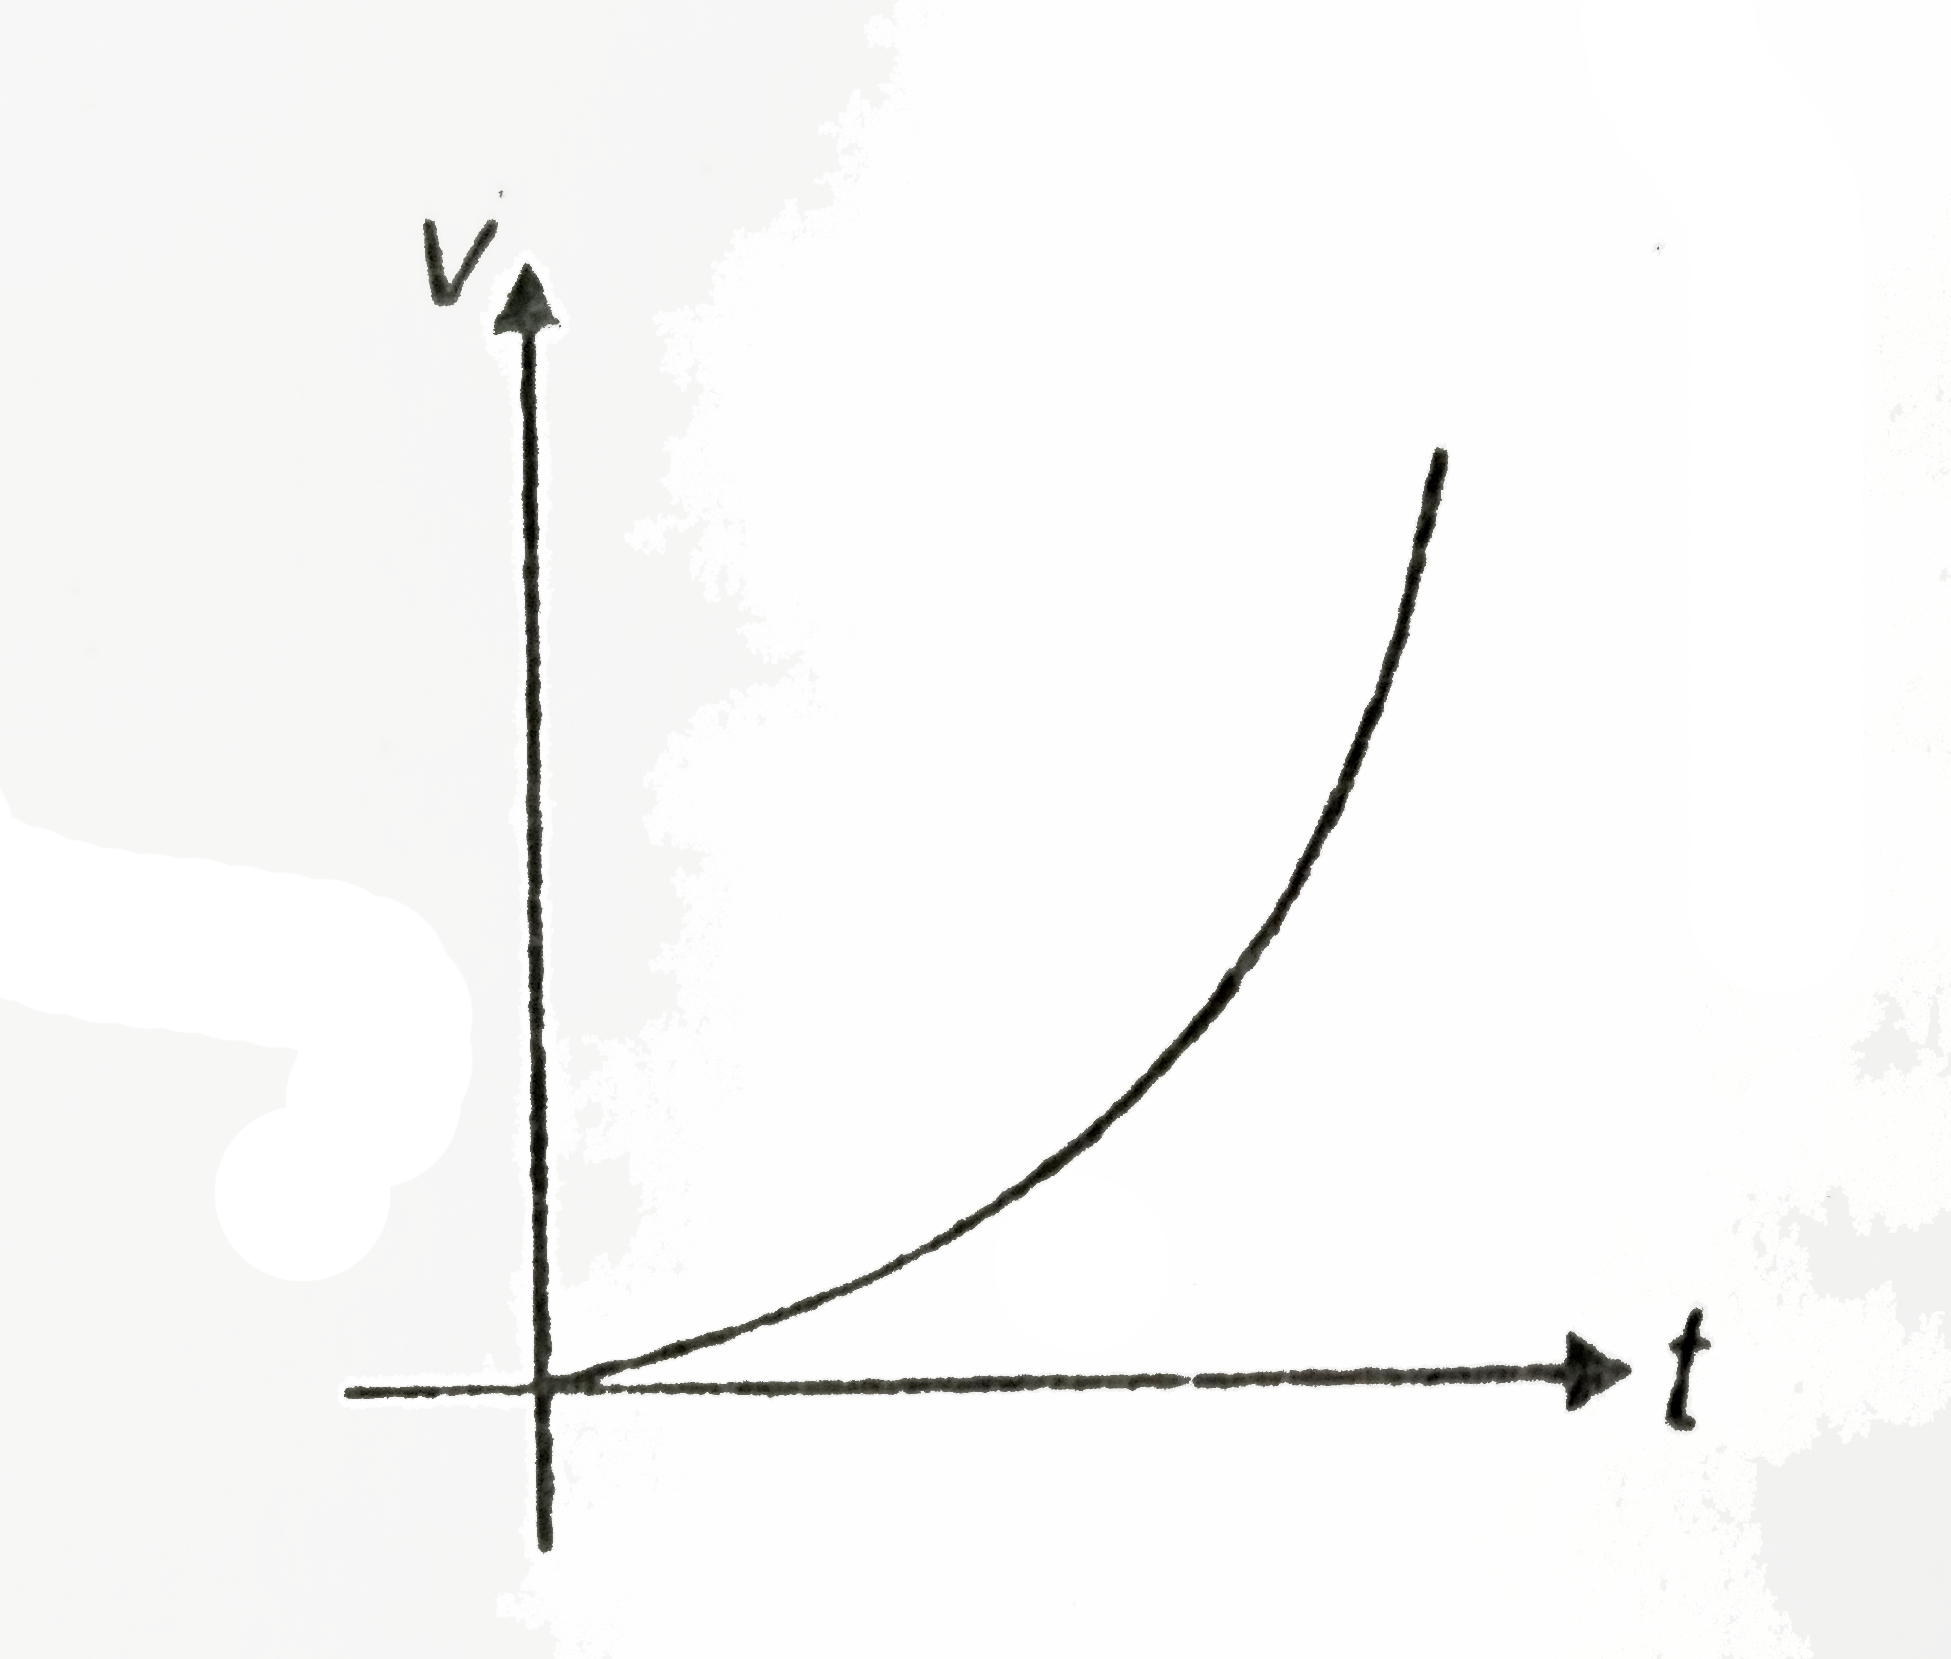
View SolutionGraphs are very useful to represent a physical situation. Various quantities can be easily represented on graphs and other quantites can be determined from the graph. For example the slope of velocity-time graph represents instantaneous acceleration. For a motion with constant acceleration slope of velocity-time graph is constant. If acceleration is changing with time, slope with change and thus velocity-time graph will be a non-linear curve. Further the area of velocity-time graph gives displacement.
The average velocity of the car for the entire trip is
View Solutionदिखाइए की किसी निश्चित समय अन्तराल में समय-त्वरण ग्राफ तथा समय-अक्ष के मध्य घिरे क्षेत्र का क्षेत्रफल उस अन्तराल में वस्तु के वेग परिवर्तन को प्रदर्शित करता है ।
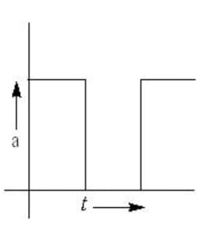
View SolutionFigure shows the acceleration-time graphs of a particle. Which of the following represents the corresponding velocity -time graph?
View Solutionएक सीधी सड़क पर जाती हुई कार के लिए वेग समय ग्राफ दिया गया है। इस दिए गए ग्राफ के संगत त्वरण - समय ग्राफ खींचे।
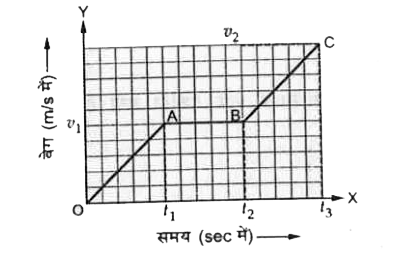
View SolutionThe velocity - time graph of a body is given in figure below .
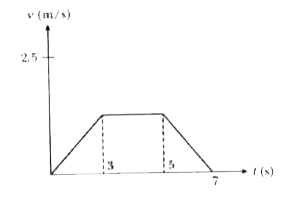
The acceleration-time graph of the motion of the body is
View SolutionFigure shows the acceleration time graph of a particle. Which of the following represents the corresponding velocity-time graph ?
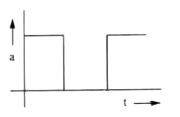
View SolutionDraw the velocity-time graph for uniformly accelerated motion. Show that slope of the velocity-time graph gives acceleration of the object.
View SolutionGraphs are very useful to represent a physical situation. Various quantities can be easily represented on graphs and other quantites can be determined from the graph. For example the slope of velocity-time graph represents instantaneous acceleration. For a motion with constant acceleration slope of velocity-time graph is constant. If acceleration is changing with time, slope with change and thus velocity-time graph will be a non-linear curve. Further the area of velocity-time graph gives displacement. The velocity-time graph for two objects P and Q are shown. The ratio of their respective acceleration is
View SolutionGraphs are very useful to represent a physical situation. Various quantities can be easily represented on graphs and other quantites can be determined from the graph. For example the slope of velocity-time graph represents instantaneous acceleration. For a motion with constant acceleration slope of velocity-time graph is constant. If acceleration is changing with time, slope will change and thus velocity-time graph will be a non-linear curve. Further the area of velocity-time graph gives displacement.
For the given velocity-time graph the possibly correct acceleration-time relationship is

View Solution
