Solve the following examples: (numerical problems)
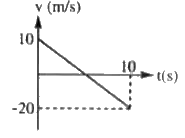
A particle of mass 10^(-10) kg moves in a straight line. Figure shows how its speed changes with time. Answer the following questions based on it.
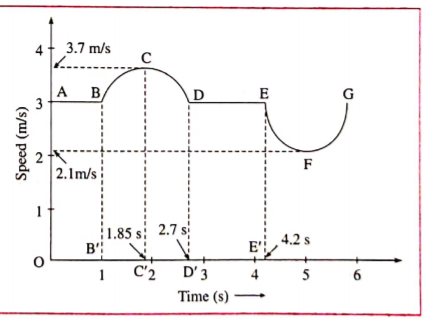
Find the average acceleration of the particle in the time OC'.Solution in Marathi
Step by step video & image solution for Solve the following examples: (numerical problems) A particle of mass 10^(-10) kg moves in a straight line. Figure shows how its speed changes with time. Answer the following questions based on it. Find the average acceleration of the particle in the time OC'. by Physics experts to help you in doubts & scoring excellent marks in Class 9 exams.
Updated on:21/07/2023Topper's Solved these Questions
- LAWS OF MOTIONBOOK - NAVNEET PUBLICATIONCHAPTER - LAWS OF MOTIONEXERCISE - EXERCISE
196 Videos
- CURRENT ELECTRICITYBOOK - NAVNEET PUBLICATIONCHAPTER - CURRENT ELECTRICITYEXERCISE - EXERCISE
215 Videos
- MEASUREMENT OF MATTERBOOK - NAVNEET PUBLICATIONCHAPTER - MEASUREMENT OF MATTEREXERCISE - EXAMPLES
1 Videos
Similar Questions
Complete the sentences and explain them:
The minimum distance between the start and finish points of the motion of an object is called the ........ of the object.
View SolutionFill in the blanks:
The coulomb is the SI unit of………….
View SolutionWhat is the Dalton's atomic theory?
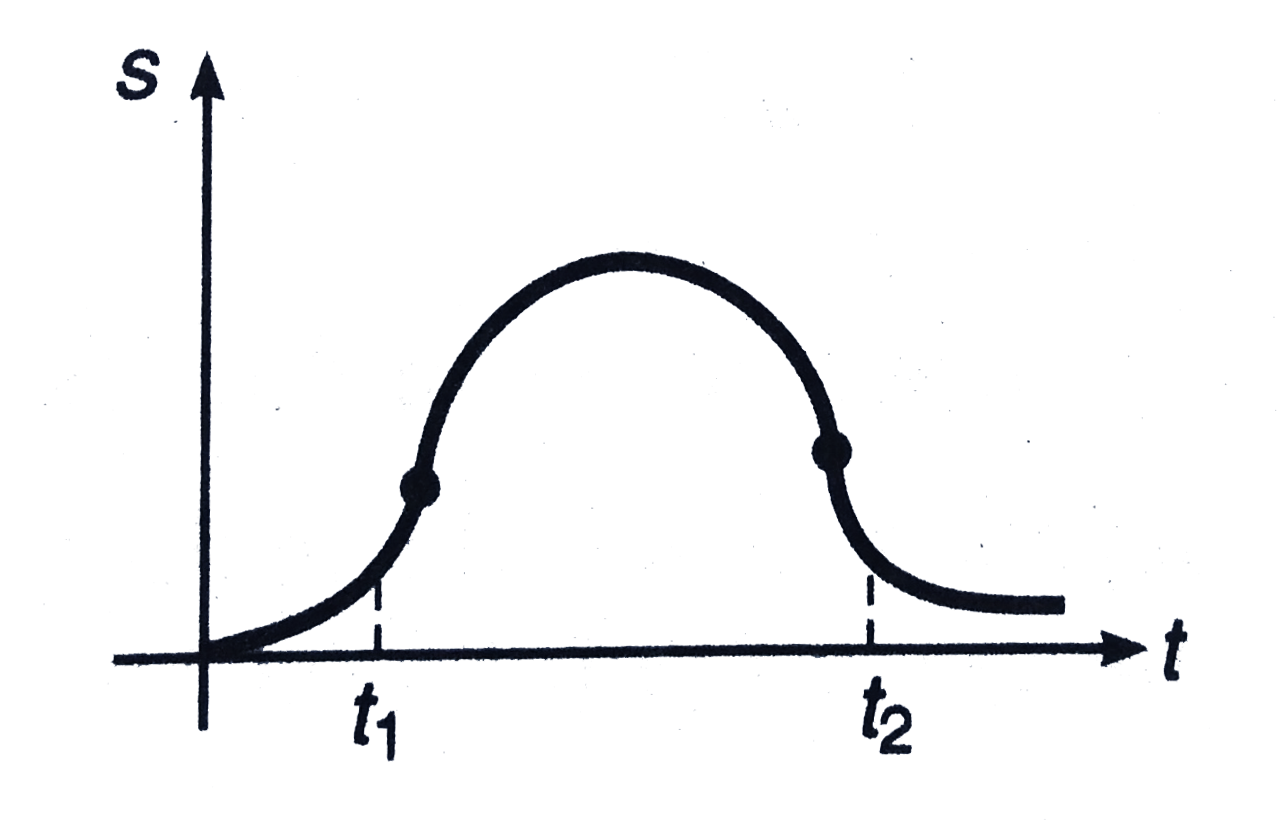
View SolutionFigure shows the displacement-time graph of a particle moving in a straight line. Find the signs of velocity and acceleration of particle at time t = t_1 and t = t_2.
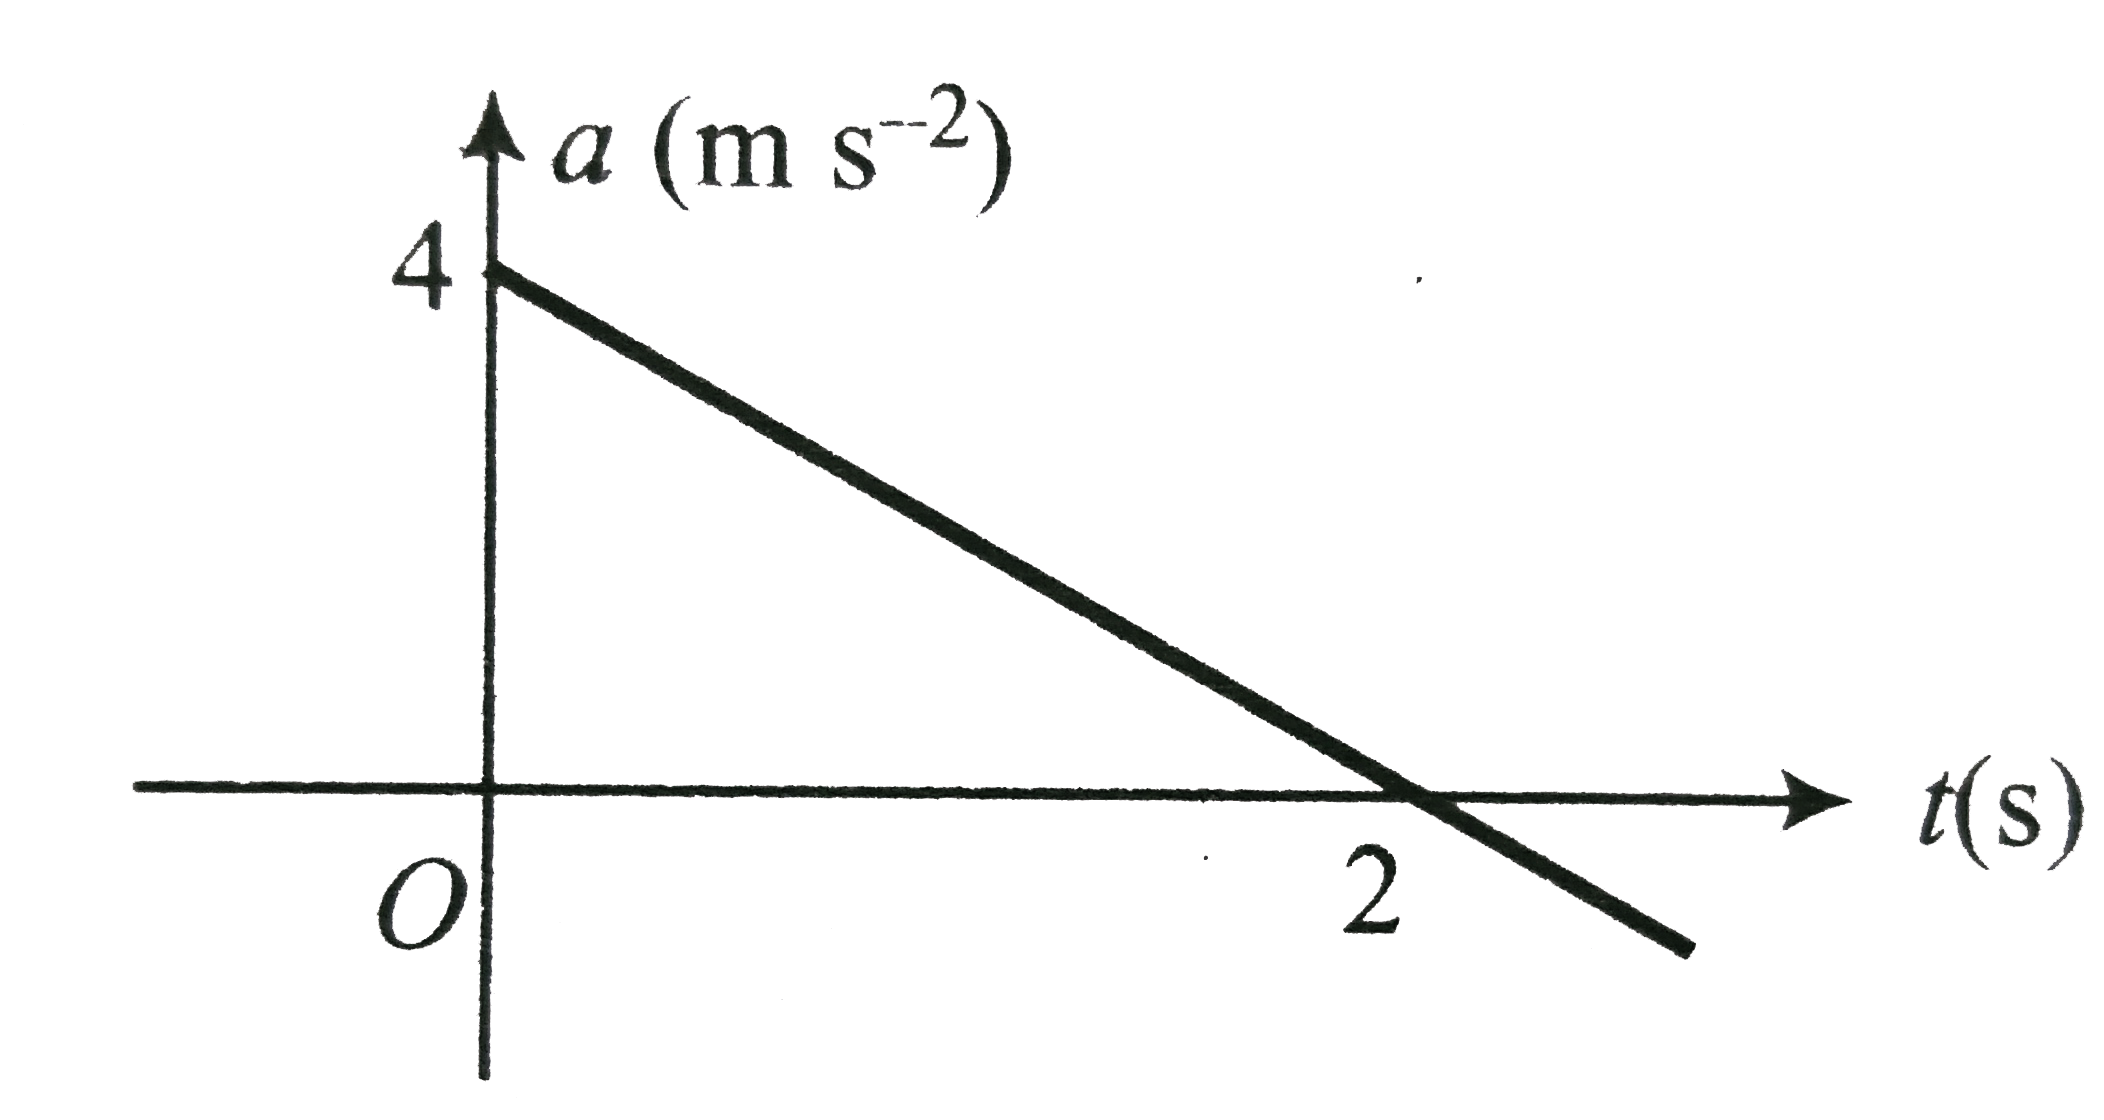
View SolutionFigure shows the acceleration-time graph of a particle moving along a straight line. After what time the particle acquires its initial velocity?
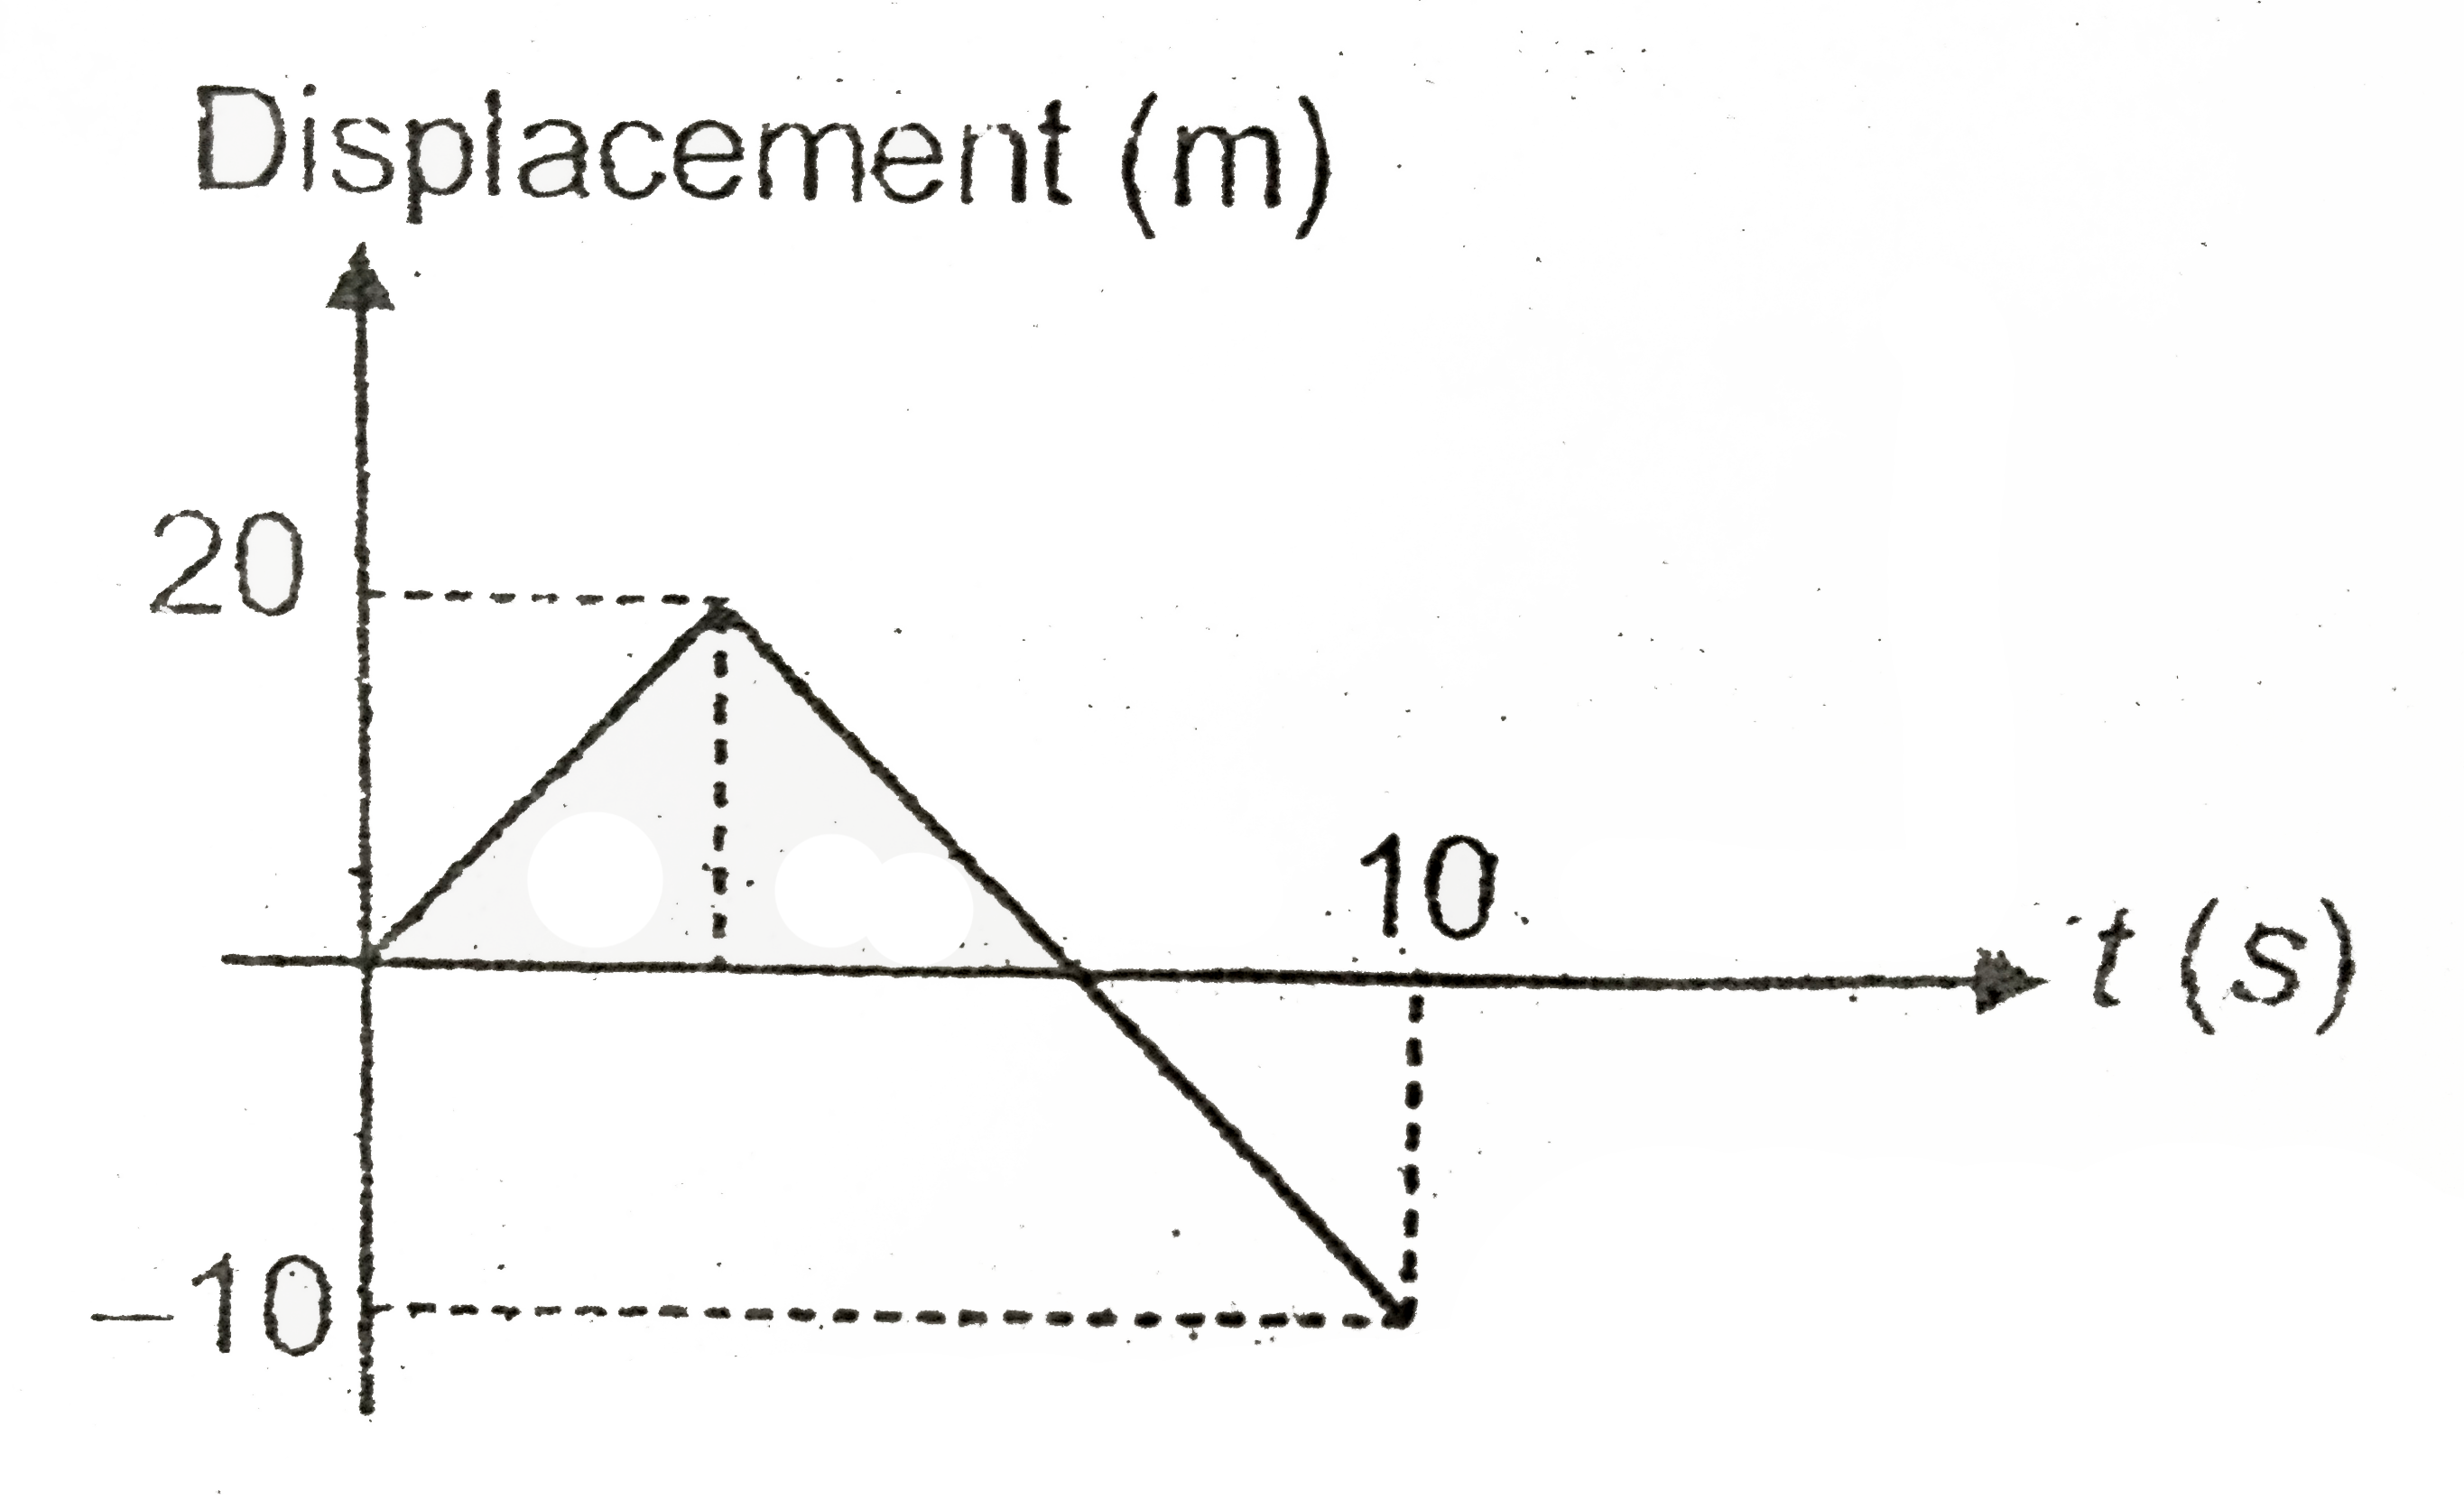
View SolutionThe diagram shows the displacement-time graph for the particle moving in a straight line. What is average speed (in m/s) for the interval 0-10 s?
View SolutionVelocity-time graph of a particle moving in a straight line is shown in the figure. Mass of the particle is 2 kg. Work done by all the forces acting on the particle in time interval t = 0 to t = 10 sec is
View Solutionएक सरल रेखा में गति करते हुए कण का विस्थापन-समय ग्राफ चित्र में दर्शाया गया है।
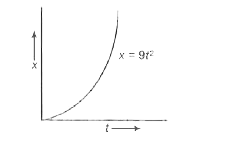
इस कण का त्वरण-समय ग्राफ है
View SolutionThe velocity-time plot for a particle moving on a straight line is shown in the figure (a) The particle has a constant acceleration. (b) The particle has never turned around. (c) The particle has zero displacement. (d) The average speed in the interval 0 to 10s is the same as the average speed in the in terval 10 s to 20 s
View SolutionThe velocity-time plot for a particle moving on a straight line is shown in the figure
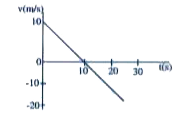
a) The particle has a constant acceleration.
b) The particle has never turned around.
c) The particle has zero displacement.
d) The average speed in the interval 0 to 10s is the same as the average speed in the interval to 10s to 20S
View SolutionVelocity - time graph of a particle moving in a straight line is as shown in figure. Mass of the particle is 2 kg. Work done by all the forces acting on the particle in time interval between t = to t = 10 is
View SolutionFigure shows the displacement-time graph of a particle moving in a straight line. Find the signs of velocity and acceleration of particle at time t=t1andt=t2.
View SolutionFigure shows the acceleration-time graph of a particle moving along a straight line. After what time the particle acquires its initial velocity?
View SolutionThe acceleration versus time graph of a particle moving in a straight line is show in. The velocity-time graph of the particle would be
 .
.
View SolutionThe diagram shows the displacement-time graph for the particle moving in a straight line. What is average speed (in m/s) for the interval 0-10 s?
View Solution
