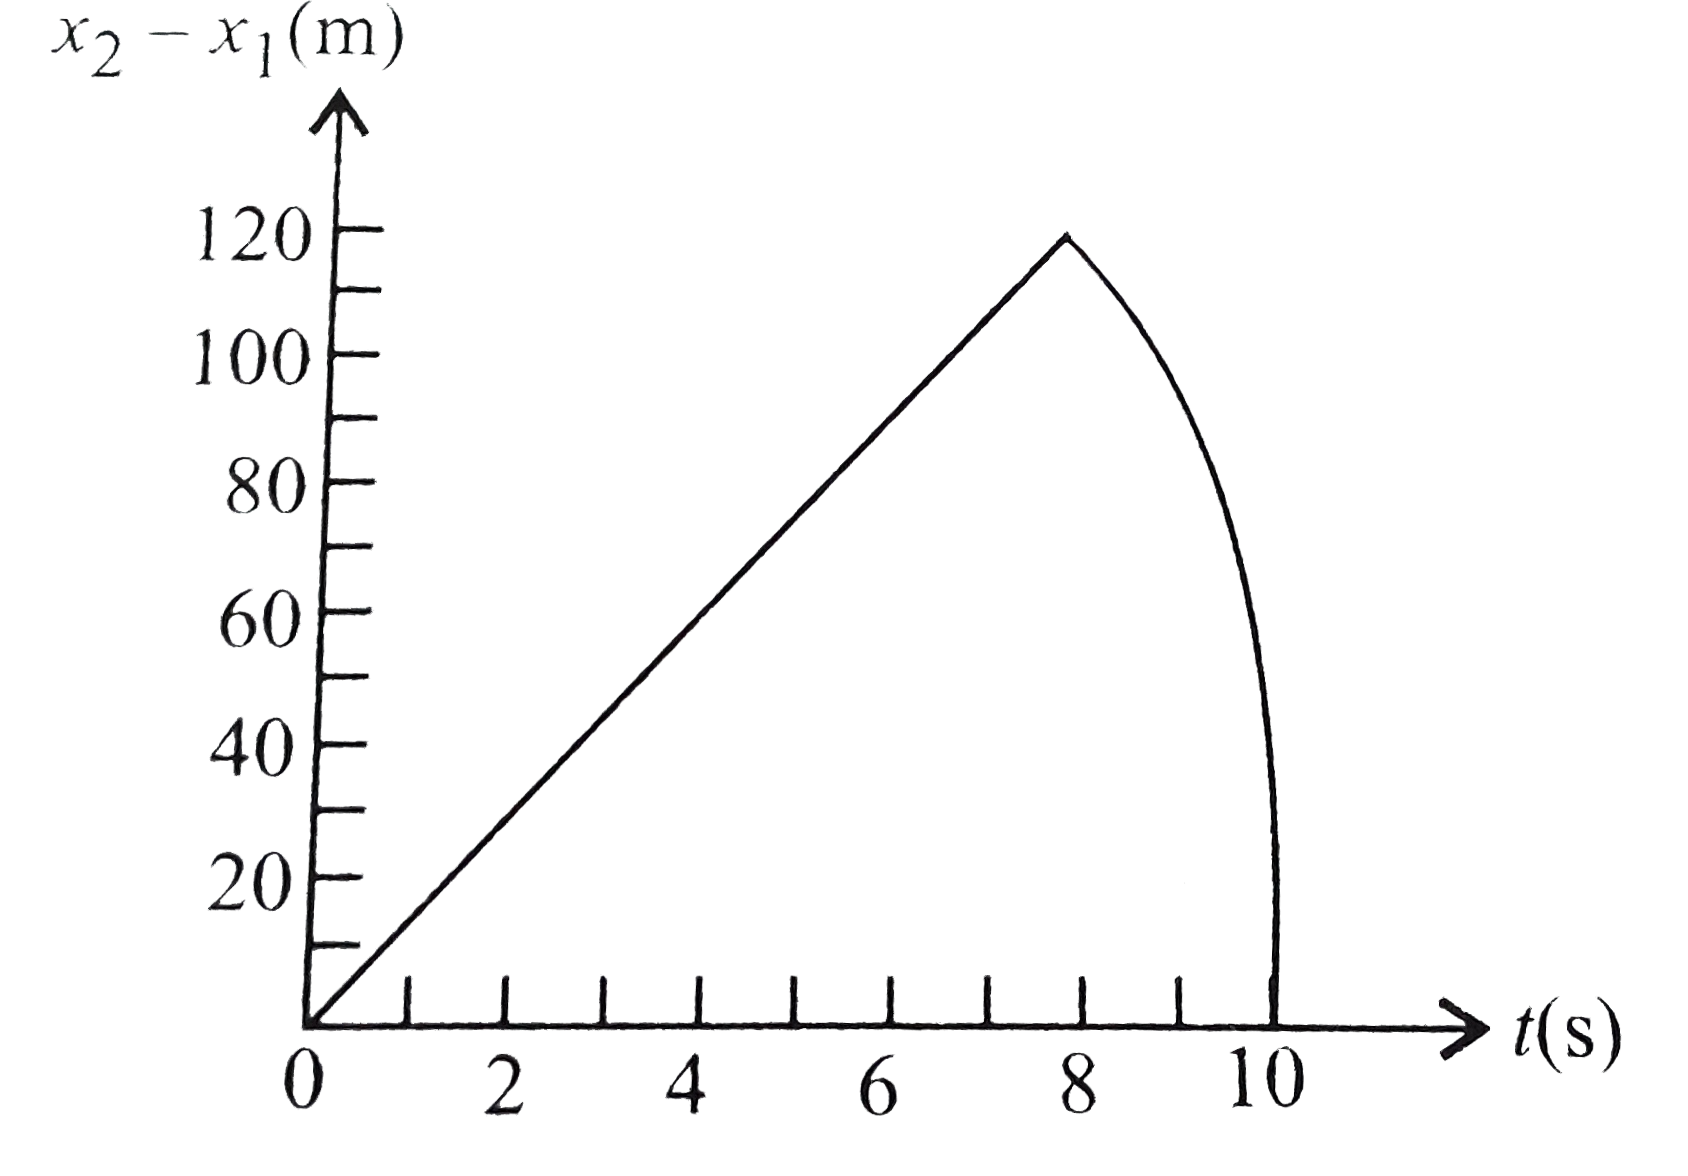
Two stones are through up simultaneously from the edge of a cliff 240 m high with initial speed of 10 m/s and 40 m/s respectively. Which of the following graphs best represents the time variation of relative position of the second stone with respect to the first? Assume stones do not rebound after hitting the ground and neglect air resistance, take . (The figures are schematic and not drawn to scale)
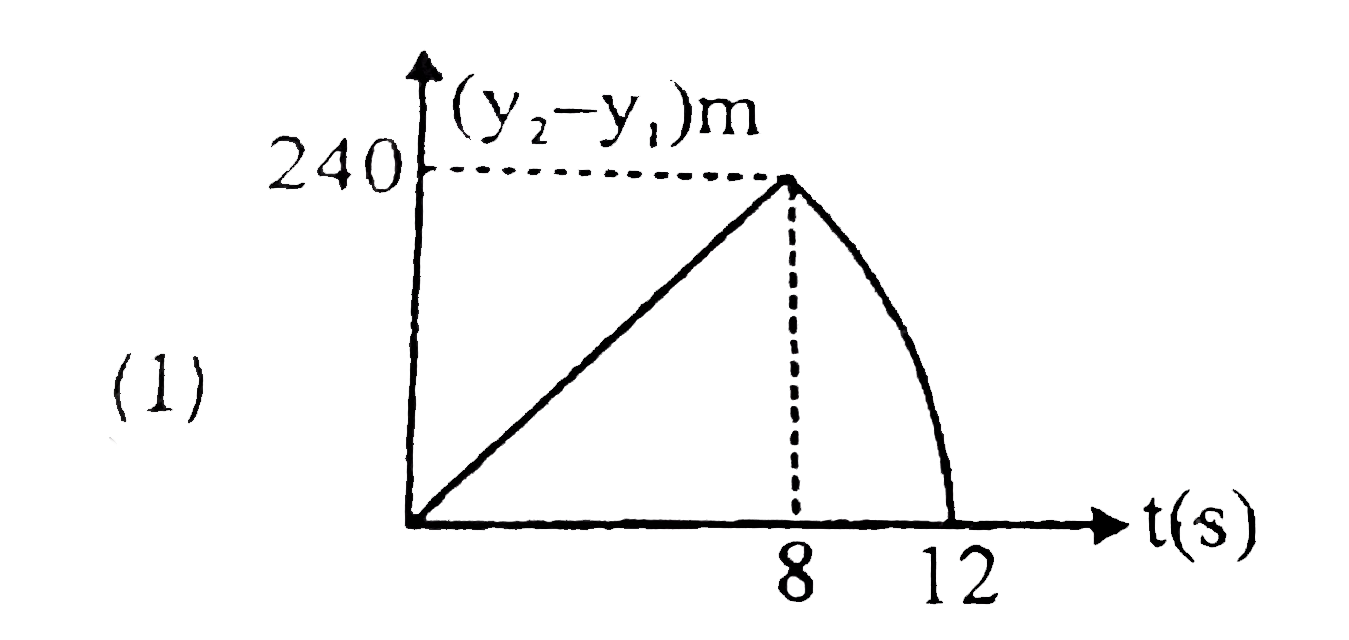
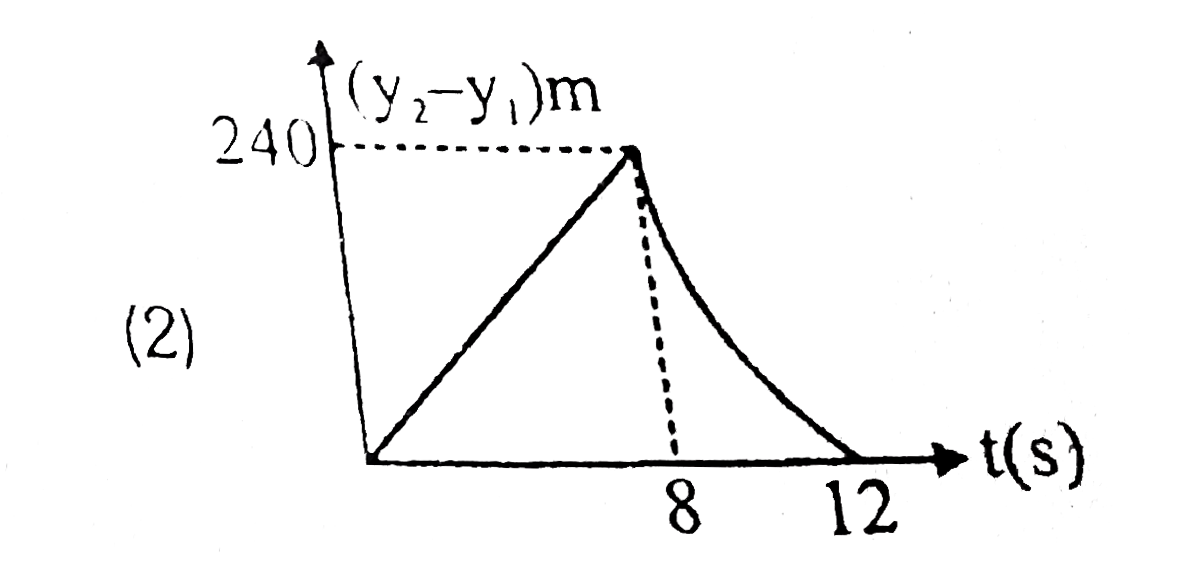
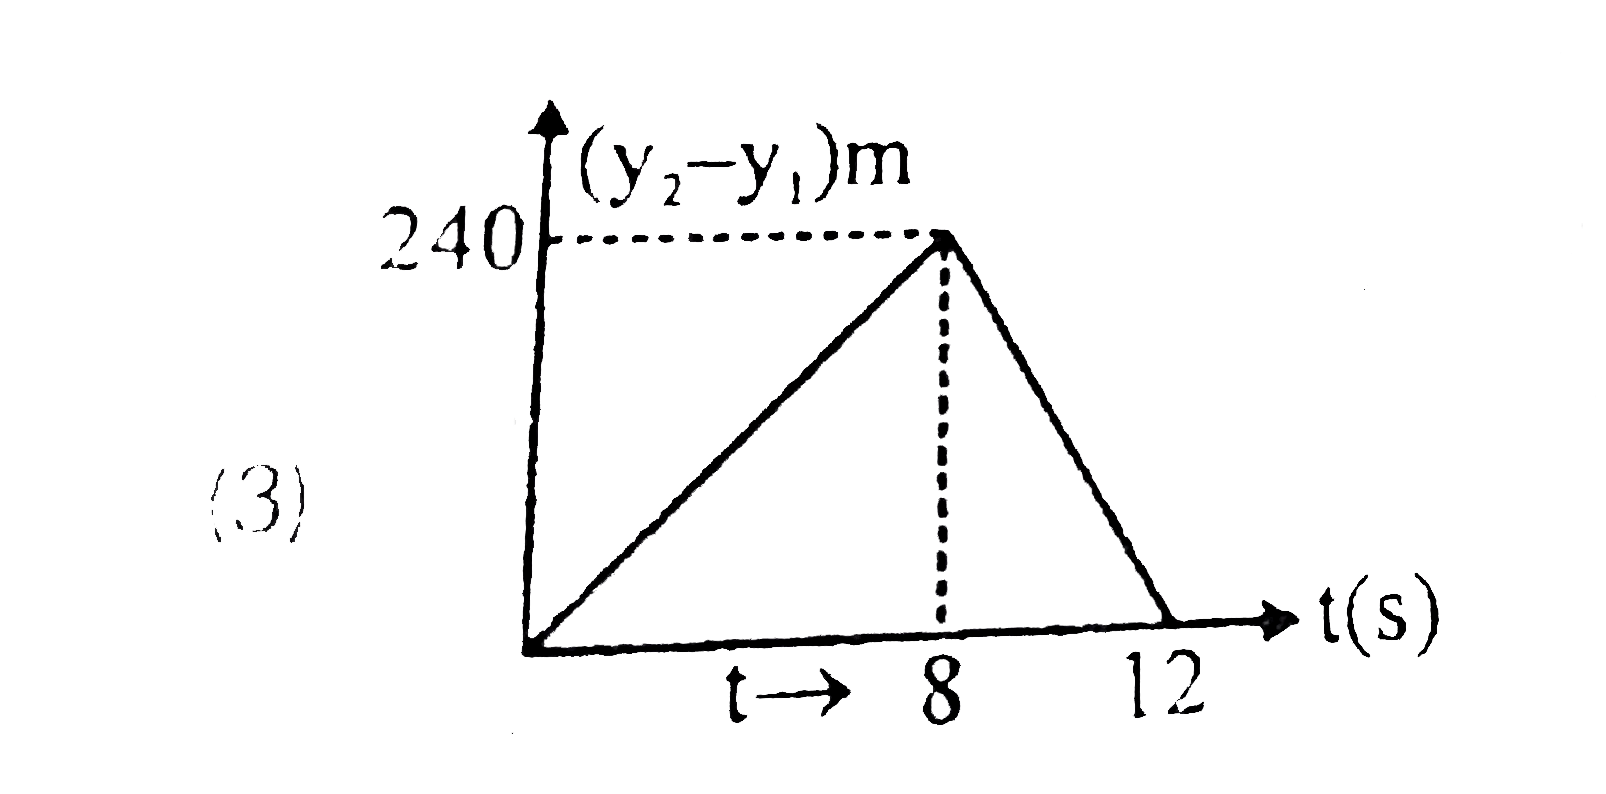
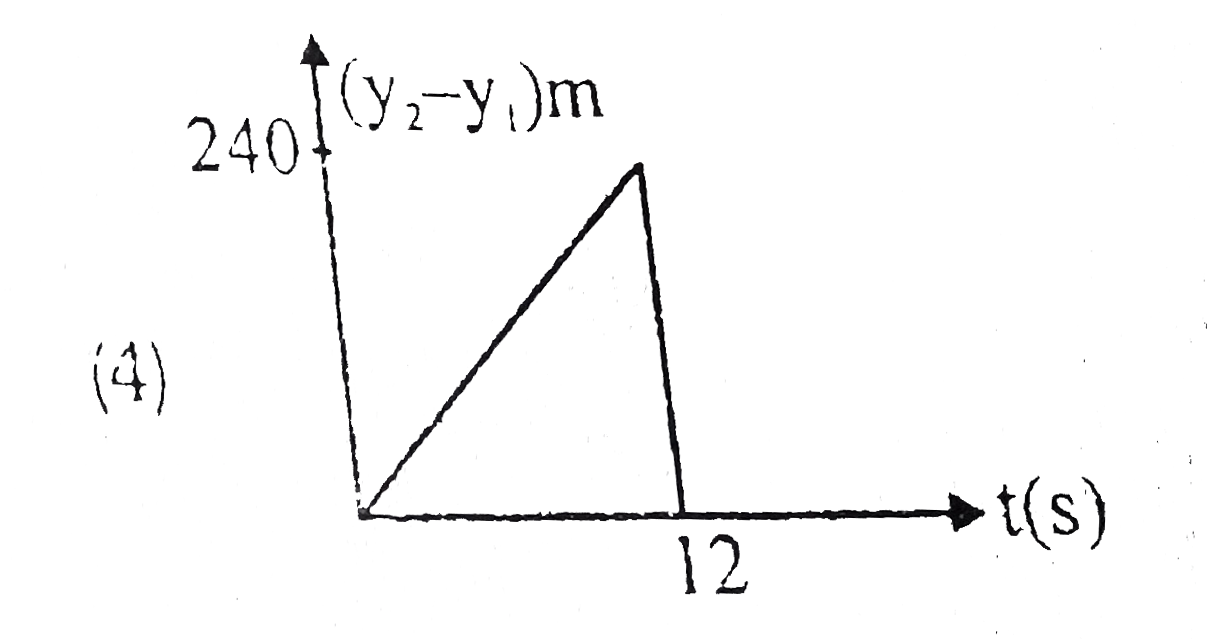
The correct Answer is:1
Step by step video & image solution for Two stones are through up simultaneously from the edge of a cliff 240 m high with initial speed of 10 m/s and 40 m/s respectively. Which of the following graphs best represents the time variation of relative position of the second stone with respect to the first? Assume stones do not rebound after hitting the ground and neglect air resistance, take . g= 10 m//s^(2) (The figures are schematic and not drawn to scale) by Physics experts to help you in doubts & scoring excellent marks in Class 11 exams.
Updated on:21/07/2023Topper's Solved these Questions
- KINEMATICSBOOK - ALLENCHAPTER - KINEMATICSEXERCISE - Exercise-05[B]
5 Videos
- KINEMATICSBOOK - ALLENCHAPTER - KINEMATICSEXERCISE - MCQ with one or more than one correct Question
1 Videos
- KINEMATICSBOOK - ALLENCHAPTER - KINEMATICSEXERCISE - Exercise-04[B]
14 Videos
- ERROR AND MEASUREMENTBOOK - ALLENCHAPTER - ERROR AND MEASUREMENTEXERCISE - Part-2(Exercise-2)(B)
22 Videos
- KINEMATICS (MOTION ALONG A STRAIGHT LINE AND MOTION IN A PLANE)BOOK - ALLENCHAPTER - KINEMATICS (MOTION ALONG A STRAIGHT LINE AND MOTION IN A PLANE)EXERCISE - BEGINNER S BOX-7
8 Videos
Similar Questions
Two stones are thrown up simultaneously from the edge of a cliff with initial speed vand2v. The relative position of the second stone with respect to first varies with time till both the stones strike the ground as.
View SolutionOne stone is projected horizontally from a 20m high cliff with an initial speed of 10ms−1. A second stone is simultaneously dropped from that cliff. Which of the following is true?
View Solution
Knowledge Check
Two stones are thrown up simultaneously from the edge of a cliff 200 m high with initial speeds of 15ms−1 and 30ms−1 respectively. The time variation of the relative position of the second stone with respect to the first is shown in the figure. The equation of the linear part is
 Ax2−x1 = 50tBx2−x1 = 10tCx2−x1 = 15tDx2−x1 = 20t
Two stones are thrown vertically upwards simultaneously from the same point on the ground with initial speed u1=30m/sec and u2=50m/sec. Which of the curve represent correct variation (for the time interval in which both reach the ground) of
(x2−x1) = the relative position of second stone with respect to first with time (t)
(v2−v1) = the relative velocity of second stone with respect to first with time (t).
Assuming that stones do not rebound after hitting.
View SolutionTwo stones AandB are projected simultaneously from the top of a 100−m high tower. Stone B is projected horizontally with speed 10ms−1, and stone A is droppd from the tower. Find out the following :
(a) Time of flight of the two stone
(b) Distance between two stones after 3s
(c ) Angle of strike with ground
(d) Horizontal range of particle B.
View SolutionA man standing on the edge of a cliff throws a stone straight up with initial speed (u) and then throws another stone straight down with same initial speed and from the same position. Find the ratio of the speeds. The stones would have attained when they hit ground at the base of the cliff.
View SolutionA stone released with zero velocity from the top of a tower, reaches the ground in 4s. The height of the tower is (g=10m/s2)
View SolutionA stone is thrown vertically upward with a speed of 10.0ms−1 from the edge of a cliff 65 m high. What will be its speed just before hitting the bottom ?
View SolutionA ball is thrown upwards from the top of a tower 40m high with a velocity of 10m/s. Find the time when it strikes the ground. Take g=10m/s2.
View SolutionA ball is thrown upwards from the top of a tower 40m high with a velocity of 10m/s. Find the time when it strikes the ground. Take g=10m/s2.
View Solution
