For one mole of a monoatomic gas :-
Column-IColumn-II(A)Isothermal bulk modulus, (p)−RTV2(B)Adiabatic bulk modulus (q)−5P3V(C)Slope of P-V graph in isothermal process (r)T/V(D)Slope of P-V graph in adiabatic process(s)4T/3V(t)None
Text Solution
Isothermal bulk modulus = P=RTV
Adiabatic bulk modulus =γP=5RT3V
Slope of PV graph in isothermal process =-PV=−RTV2
Slope of P−V graph in adiabatic process = −γPV=−5P3V
|
Topper's Solved these Questions
- GEOMETRICAL OPTICSBOOK - ALLENCHAPTER - GEOMETRICAL OPTICSEXERCISE - ASSERTION-REASON
36 Videos
- GEOMETRICAL OPTICSBOOK - ALLENCHAPTER - GEOMETRICAL OPTICSEXERCISE - Comprehension Based Questions
66 Videos
- GEOMETRICAL OPTICSBOOK - ALLENCHAPTER - GEOMETRICAL OPTICSEXERCISE - EXERCISE -02
82 Videos
- CURRENT ELECTRICITYBOOK - ALLENCHAPTER - CURRENT ELECTRICITYEXERCISE - EX.II
66 Videos
- GRAVITATIONBOOK - ALLENCHAPTER - GRAVITATIONEXERCISE - EXERCISE 4
9 Videos
Similar Questions
Knowledge Check
The slope of P-V graph for isochoric process is
AZeroBInfiniteCOneDTwoFor the given P-V graph for an ideal gas, chose the correct V-T graph. Process BC is adiabatic.
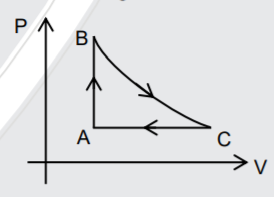 A
A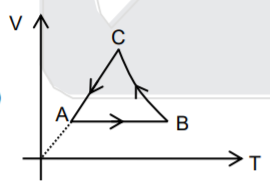 B
B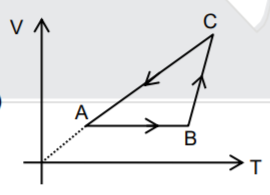 C
C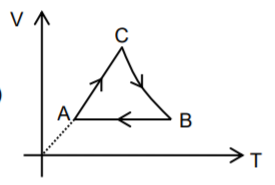 D
D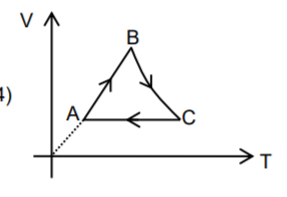
Assertion: P v/s 1V graph is straight line for adiabatic process.
Reason: PV=constant for adiabatic process.AIf both assertion and reason are true and reason is the correct explanation of assertion.BIf both assertion and reson are true but reason is not the correct explanation of assertion.Cif assertion is true but reason is false.DIf both assertion and reason are false.
Match the statement in Column I with the statements in Column II. One or more than one choice from Column II can match with a statement from Column I.
Column IColumn II(a)Young's modulus(p)−ΔVρV(b)Bulk modulus(q)FlAΔl(c)Compressibility(r)−Δd/dΔDl/l(d)Poisson's ratio(s)−ρVΔV
View SolutionFor the given P-V graph for an ideal gas, chose the correct V-T graph. Process BC is adiabatic.

View SolutionAssertion: P v/s 1V graph is straight line for adiabatic process.
Reason: PV=constant for adiabatic process.
View Solutionp−T curve for a cyclic process is as shown
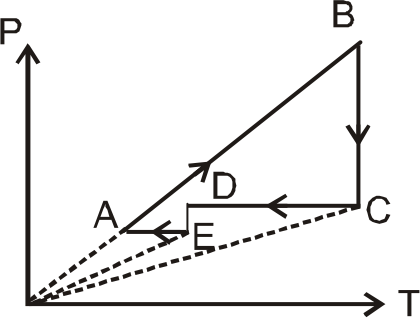
P−V graph for this process will be:
View Solutionp−T curve for a cyclic process is as shown

P−V graph for this process will be:
View Solution
