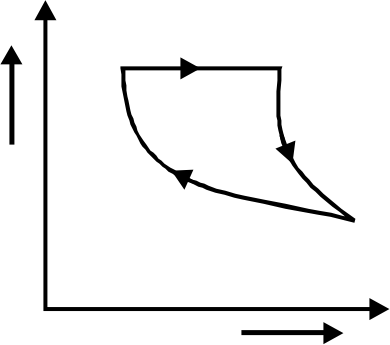
A cyclic process for an ideal gas is shown in figure . Given WAB=+700J,WBC=+400J,QCA=−100J.
_E01_232_Q01.png)
The efficiency of the cycle is -
100%
83.44%
85.71%
81.11%
The correct Answer is:C
η=WnetQinput×100=600700×100=6007=85.71%
Topper's Solved these Questions
- GEOMETRICAL OPTICSBOOK - ALLENCHAPTER - GEOMETRICAL OPTICSEXERCISE - EXERCISE - 04 (A)
47 Videos
- GEOMETRICAL OPTICSBOOK - ALLENCHAPTER - GEOMETRICAL OPTICSEXERCISE - EXERCISE - 04 (B)
15 Videos
- GEOMETRICAL OPTICSBOOK - ALLENCHAPTER - GEOMETRICAL OPTICSEXERCISE - ASSERTION-REASON
36 Videos
- CURRENT ELECTRICITYBOOK - ALLENCHAPTER - CURRENT ELECTRICITYEXERCISE - EX.II
66 Videos
- GRAVITATIONBOOK - ALLENCHAPTER - GRAVITATIONEXERCISE - EXERCISE 4
9 Videos
Similar Questions
Knowledge Check
The cyclic process for 1 mole of an ideal gas is shown in the V-T diagram. The work done in AB, BC and CA respectively is
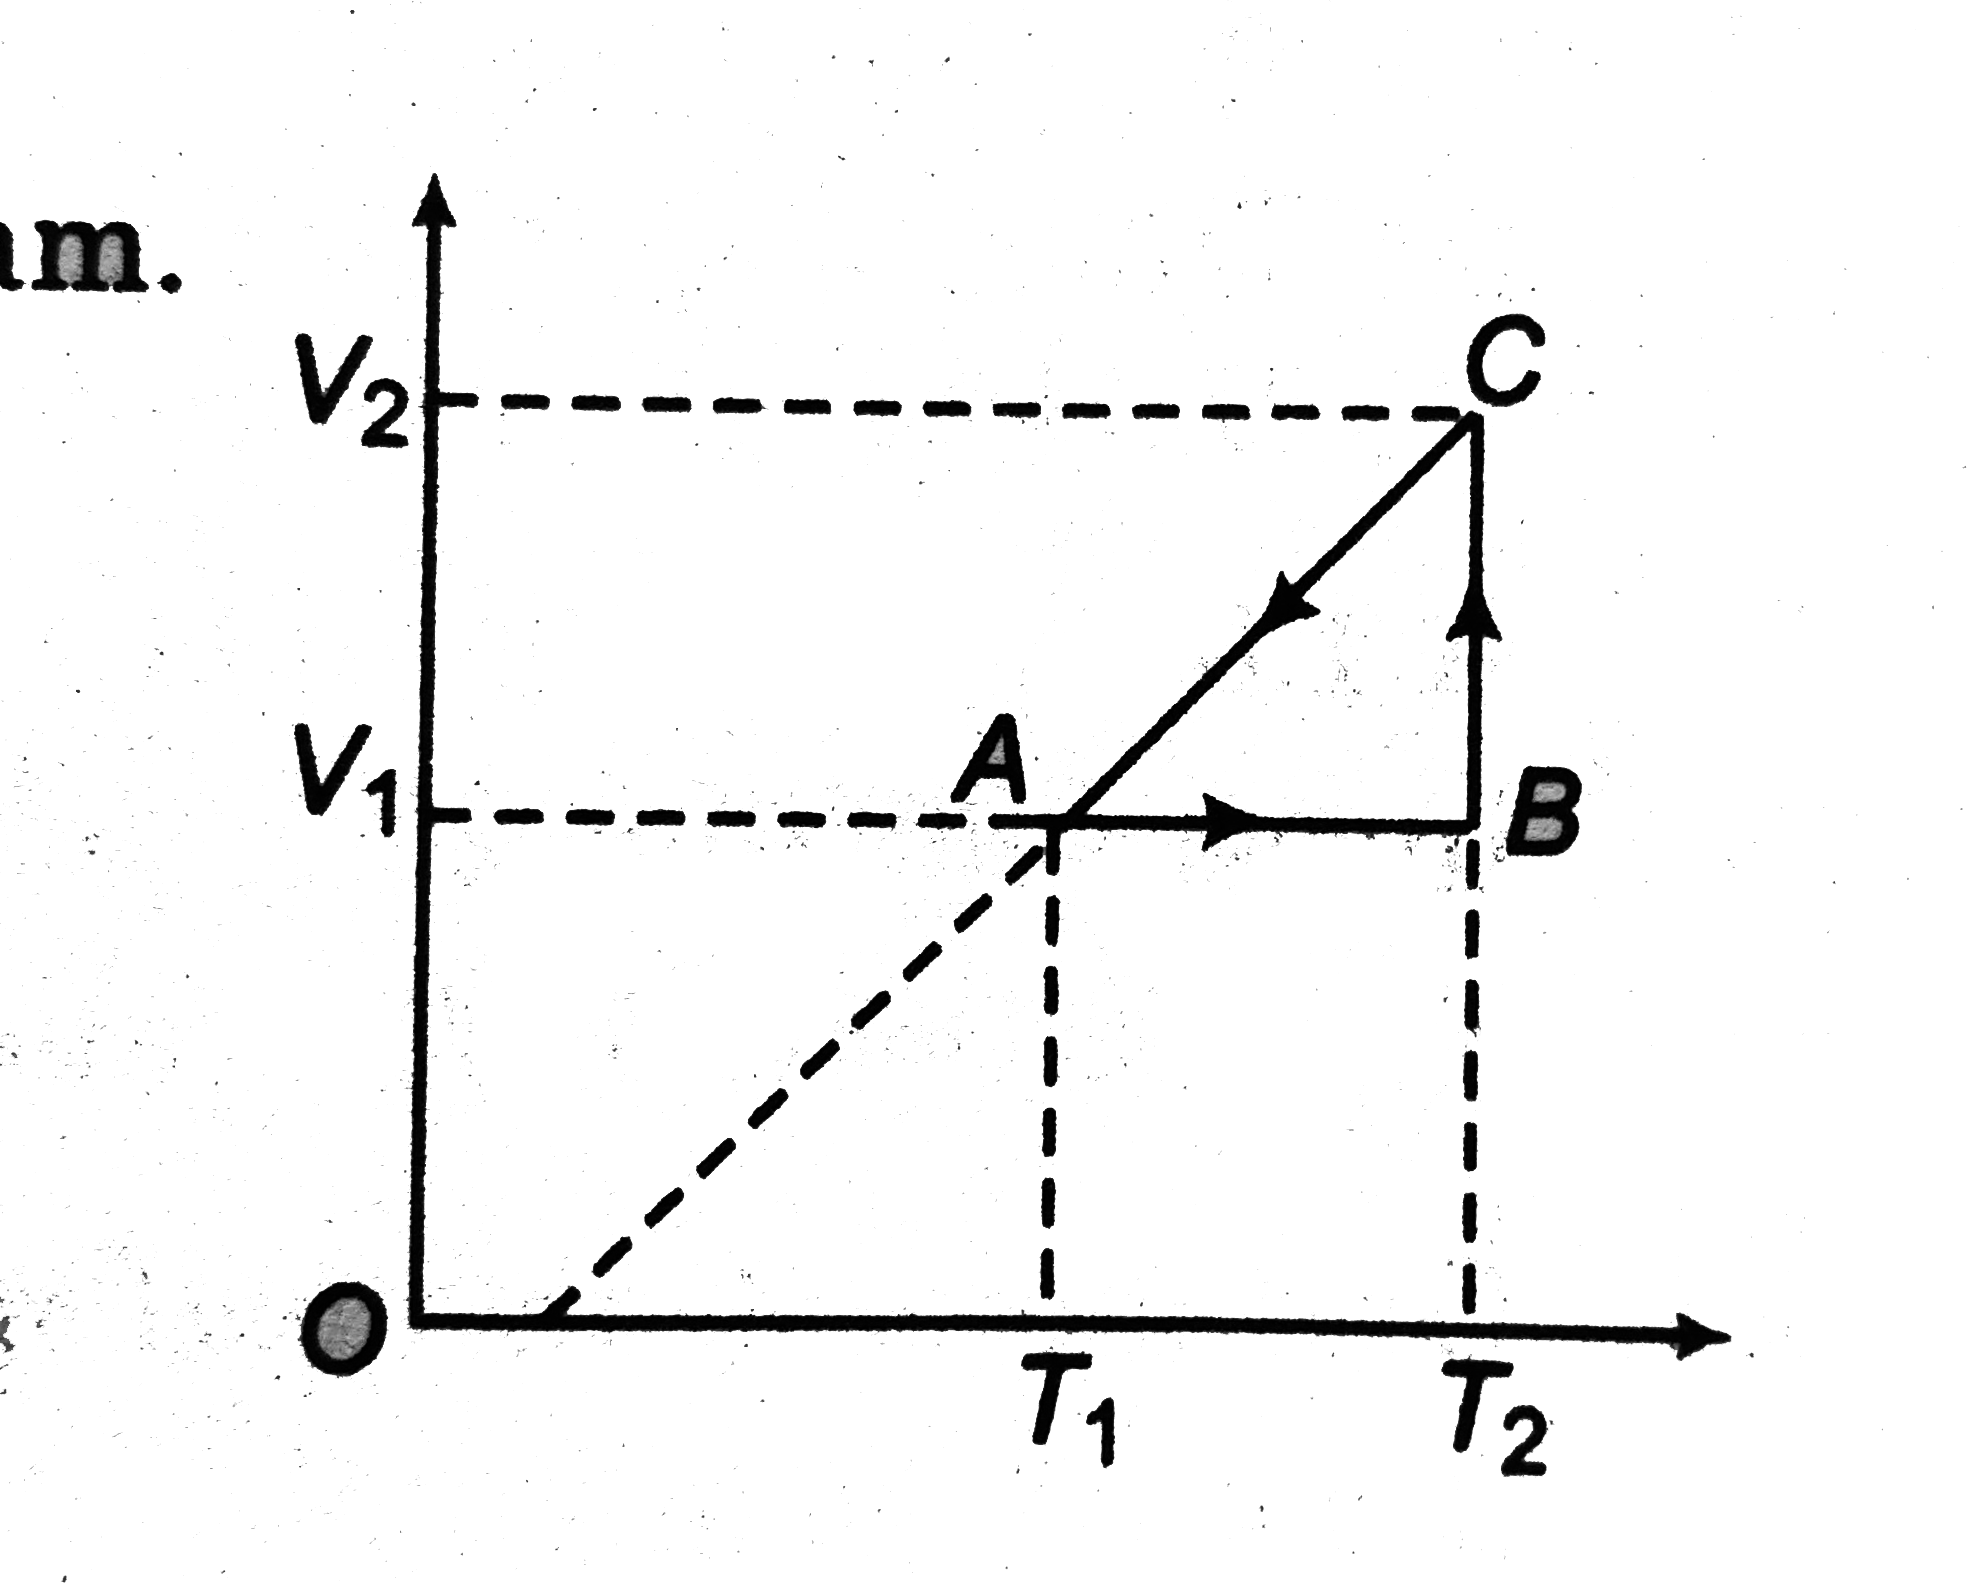 A0,RT1Ln(V1V2),R(T1−T2)BR,(T1−T2)R,RT1In(V1V2)C0,RT2ln(V2V1),RT1V1(V1−V2)D0,RT2ln(V1)V2,R(T1−T2)
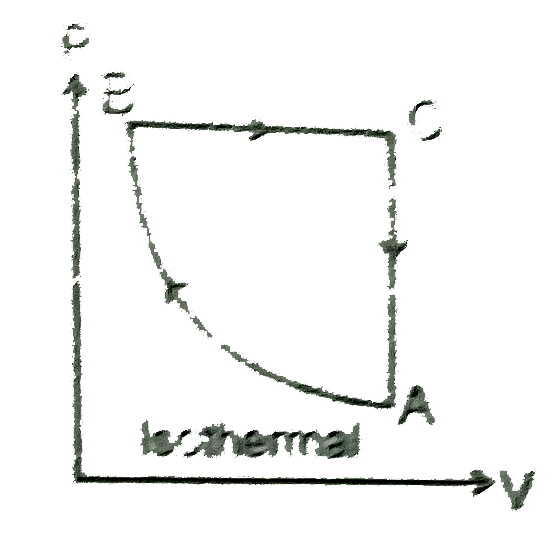
A cyclic process on an ideal monatomic gas is shown in figure . The correct statement is
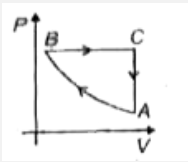
View SolutionA cyclic process of an ideal monoatomic gas is shown in figure. The correct statement is (are):
View SolutionA cyclic process contains four steps AB,BC,CD and DA. Heat involved in different processes is given as QAB=+200J,QBC=+600J,QCD=−300J,QDA=0, then efficiency of process is
View SolutionThe cyclic process for 1 mole of an ideal gas is shown in the V-T diagram. The work done in AB, BC and CA respectively is

View SolutionAn ideal gas is taken through a cyclic thermodynamics process through four steps. The amount of heat given to the system in these steps are Q1=1000J, Q2=−800J, Q3=450J, Q4=−200J respectively. The efficiency of cycle is nearly
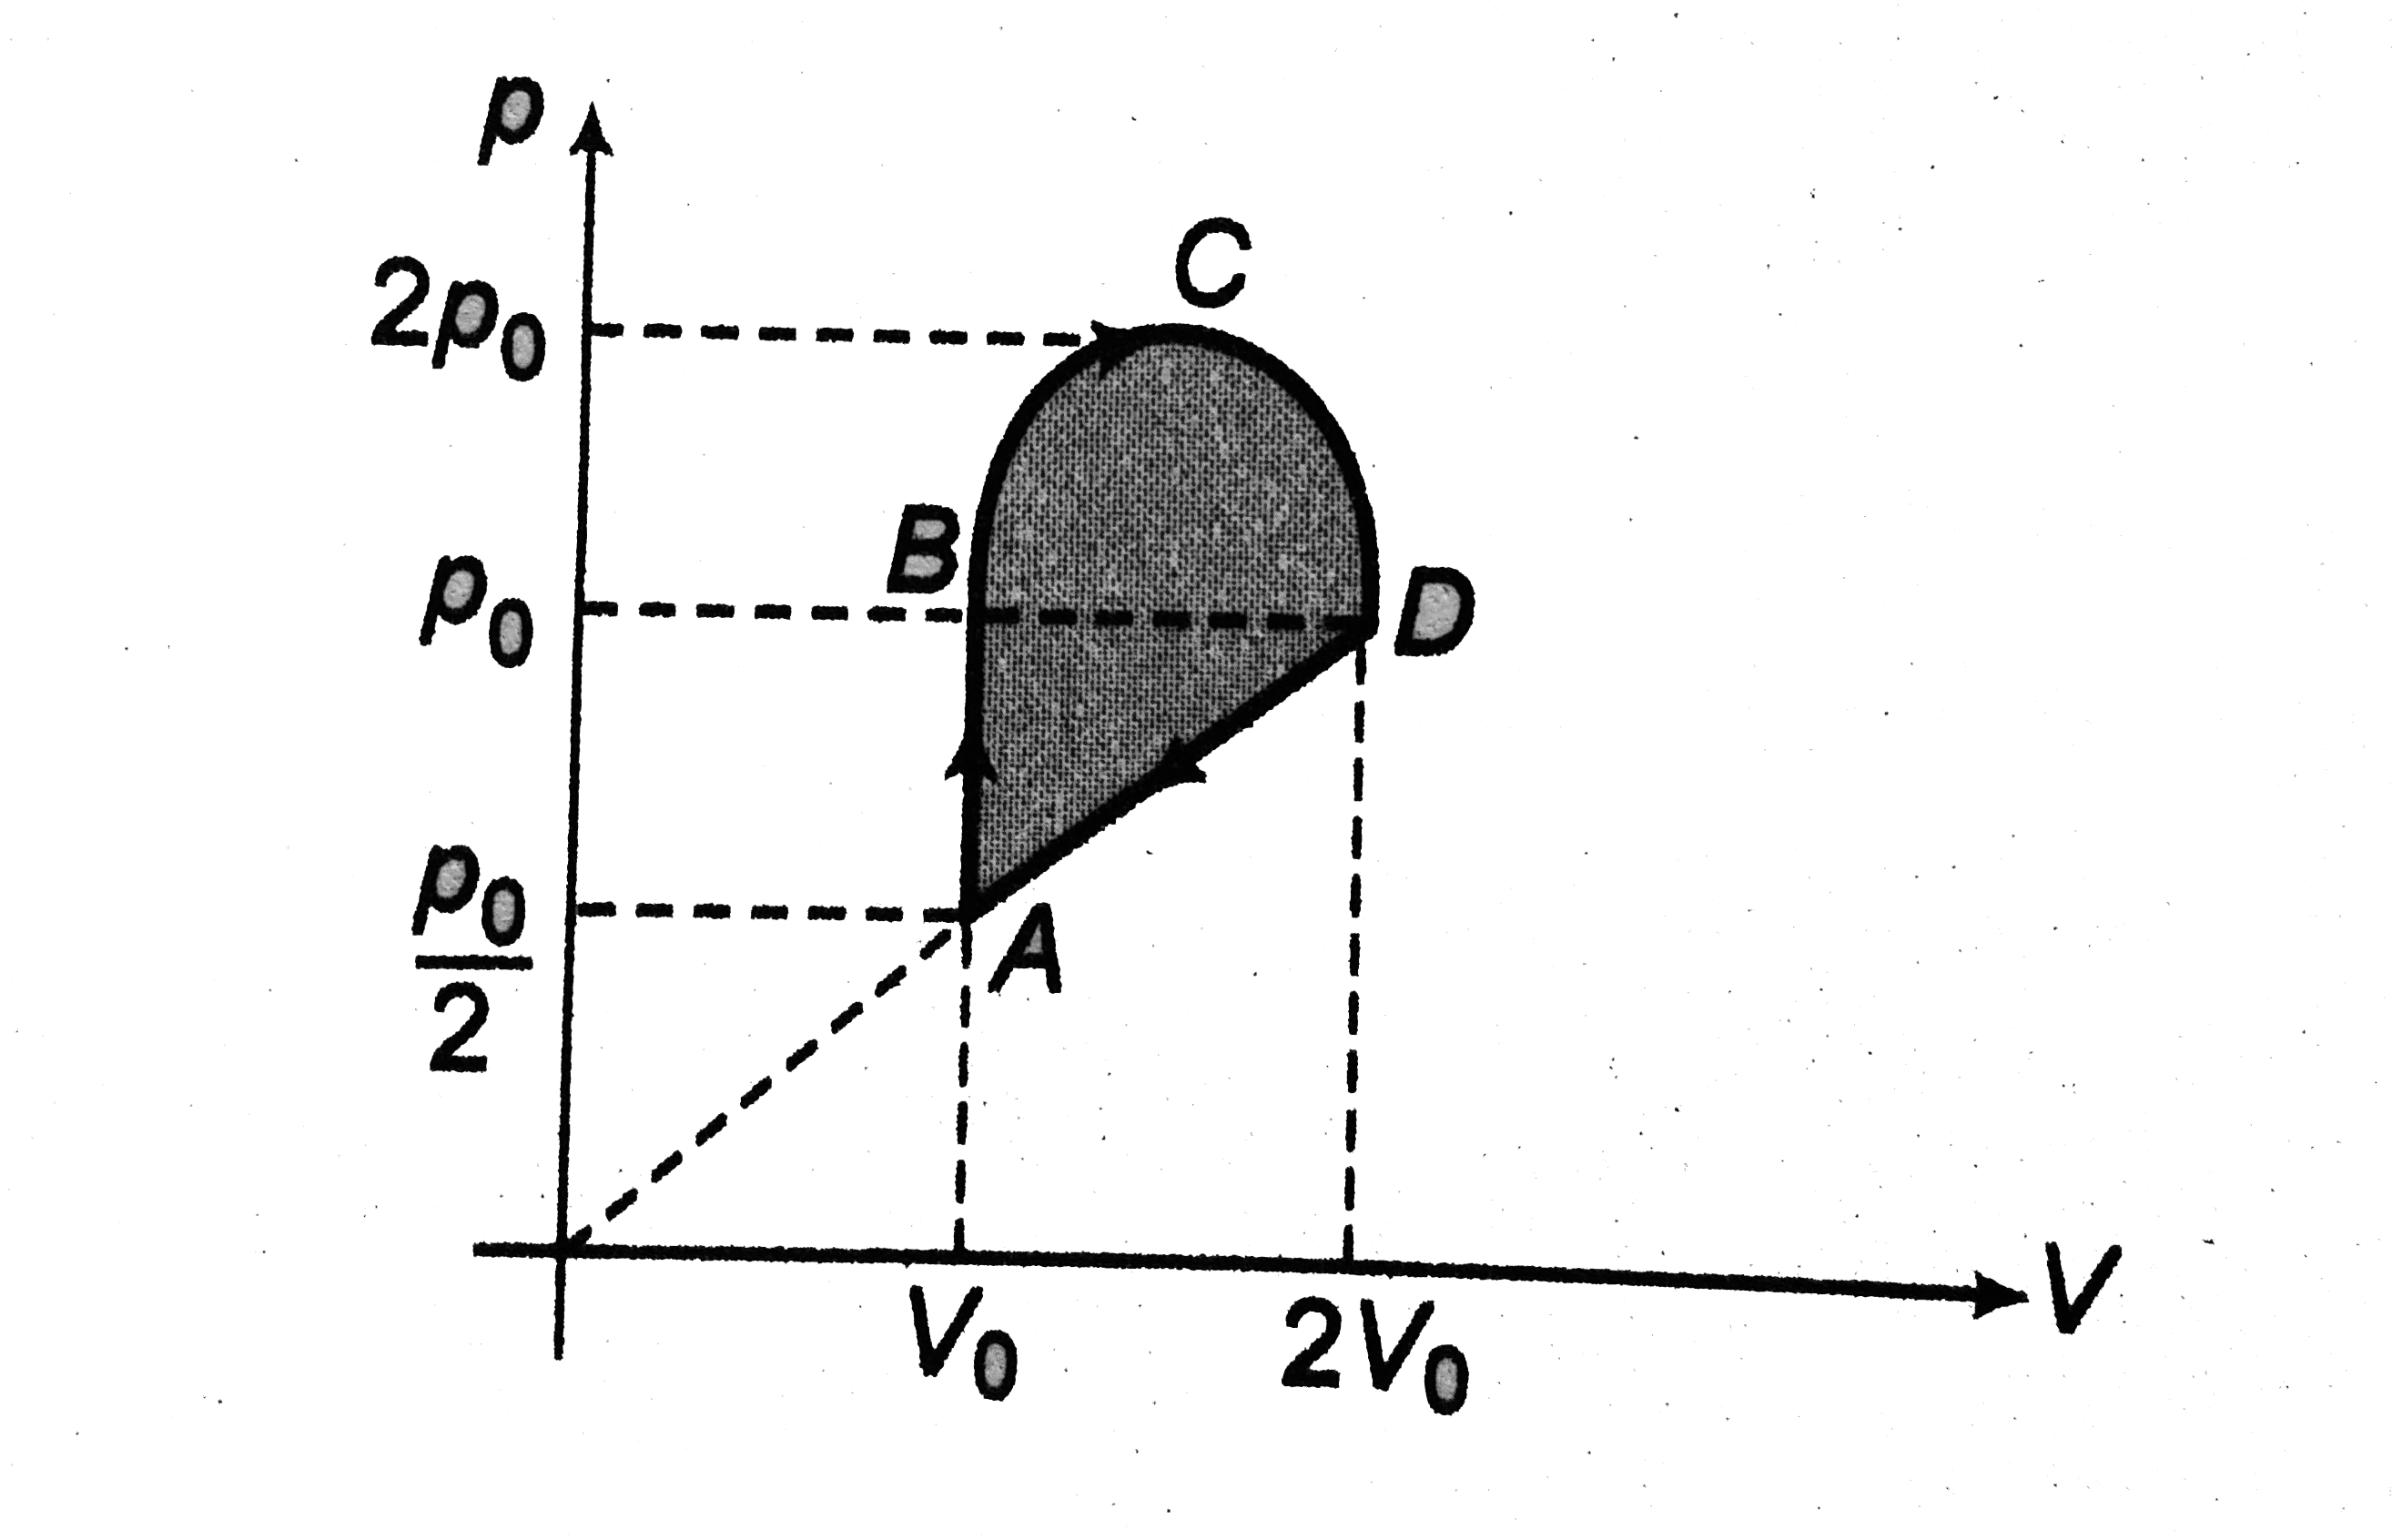
View SolutionTwo moles of a monatomic ideal gas undergo a cyclic process ABCDA as shown in figure. BCD is a semicircle. Find the efficiency of the cycle.
View SolutionFor a given thermodynamic cyclic process, P−V indicator diagram is as shown in the figure. Process AB,BC&CA are isobaric, & isothermal respectively. Then which of the following curve represent correc V−T indicator diagram for the process ABCA?
View Solution

_E01_231_Q01.png)
_E01_230_Q01.png)