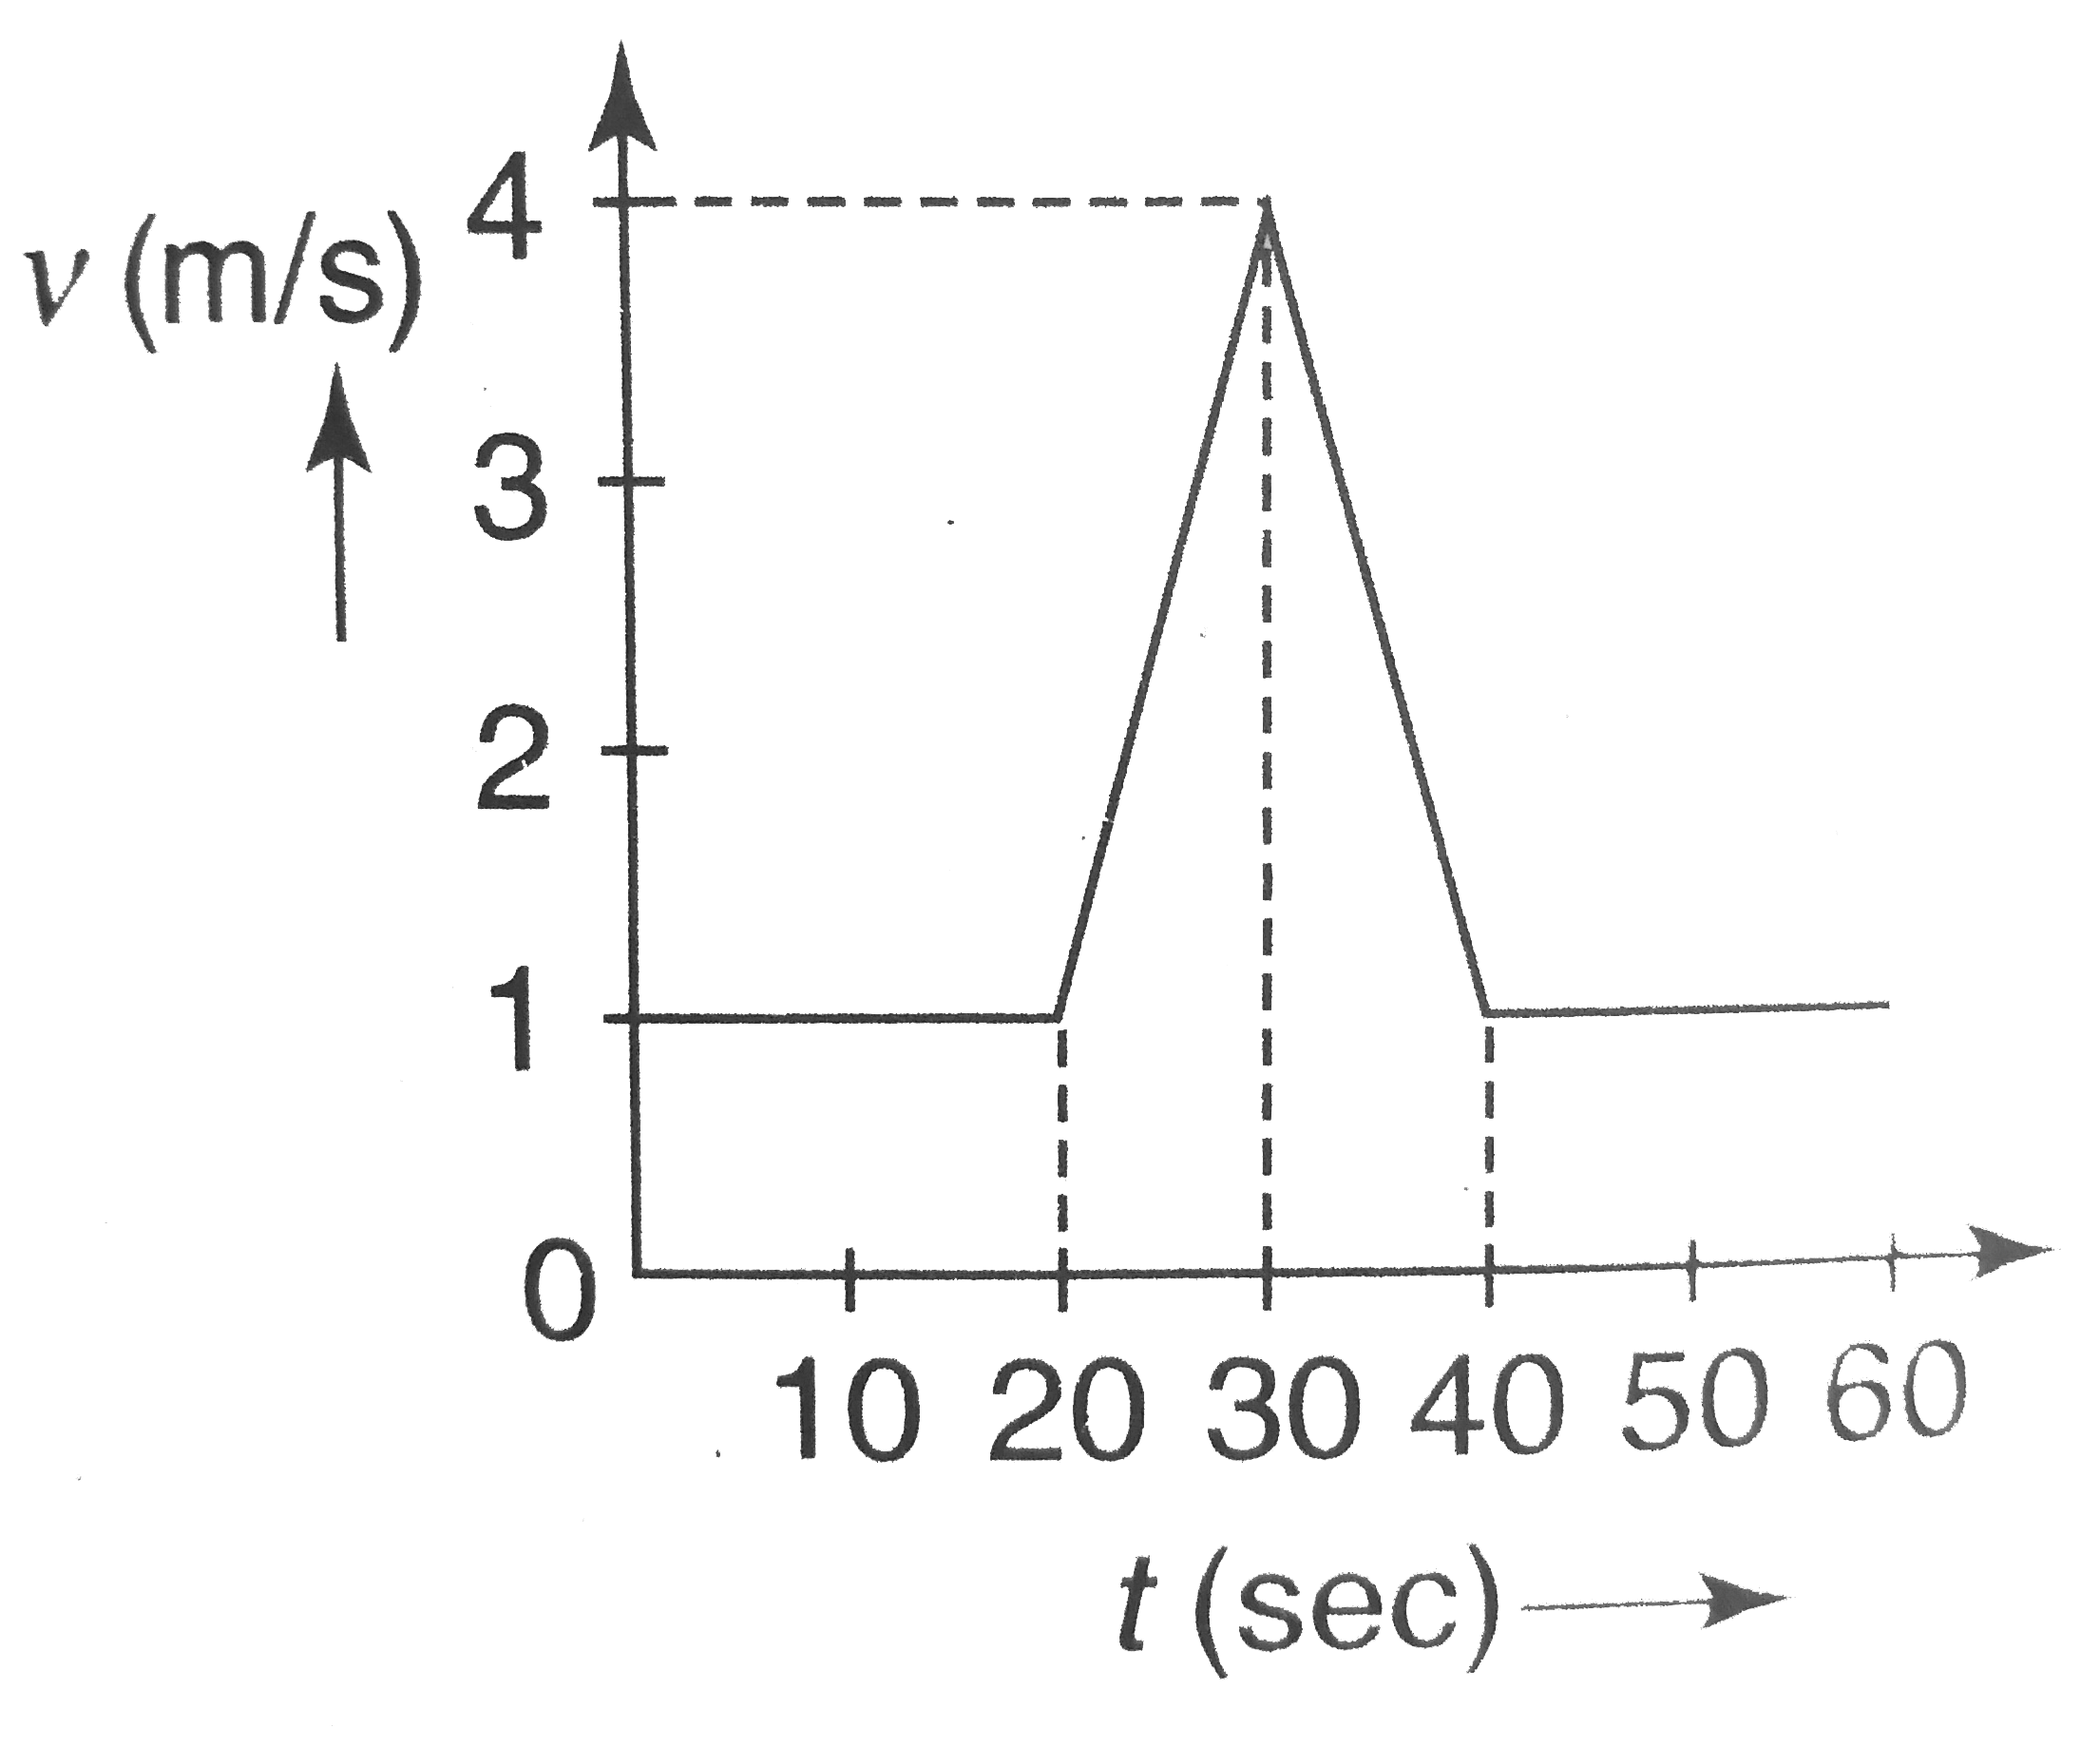
The velocity-time graph of a moving object is given in the figure. Draw the acceleration versus time and displacement versus time graph. Find the distance travelled during the time interval when the acceleration is maximum . Assume that the particle starts from origin.
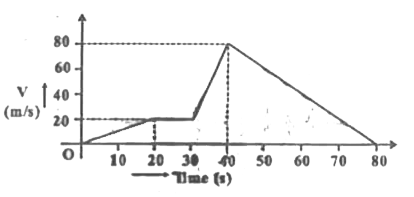
Step by step video & image solution for The velocity-time graph of a moving object is given in the figure. Draw the acceleration versus time and displacement versus time graph. Find the distance travelled during the time interval when the acceleration is maximum . Assume that the particle starts from origin. by Physics experts to help you in doubts & scoring excellent marks in Class 12 exams.
Updated on:21/07/2023Similar Questions
Draw the velocity-time graph of an object moving with uniform negative acceleration.
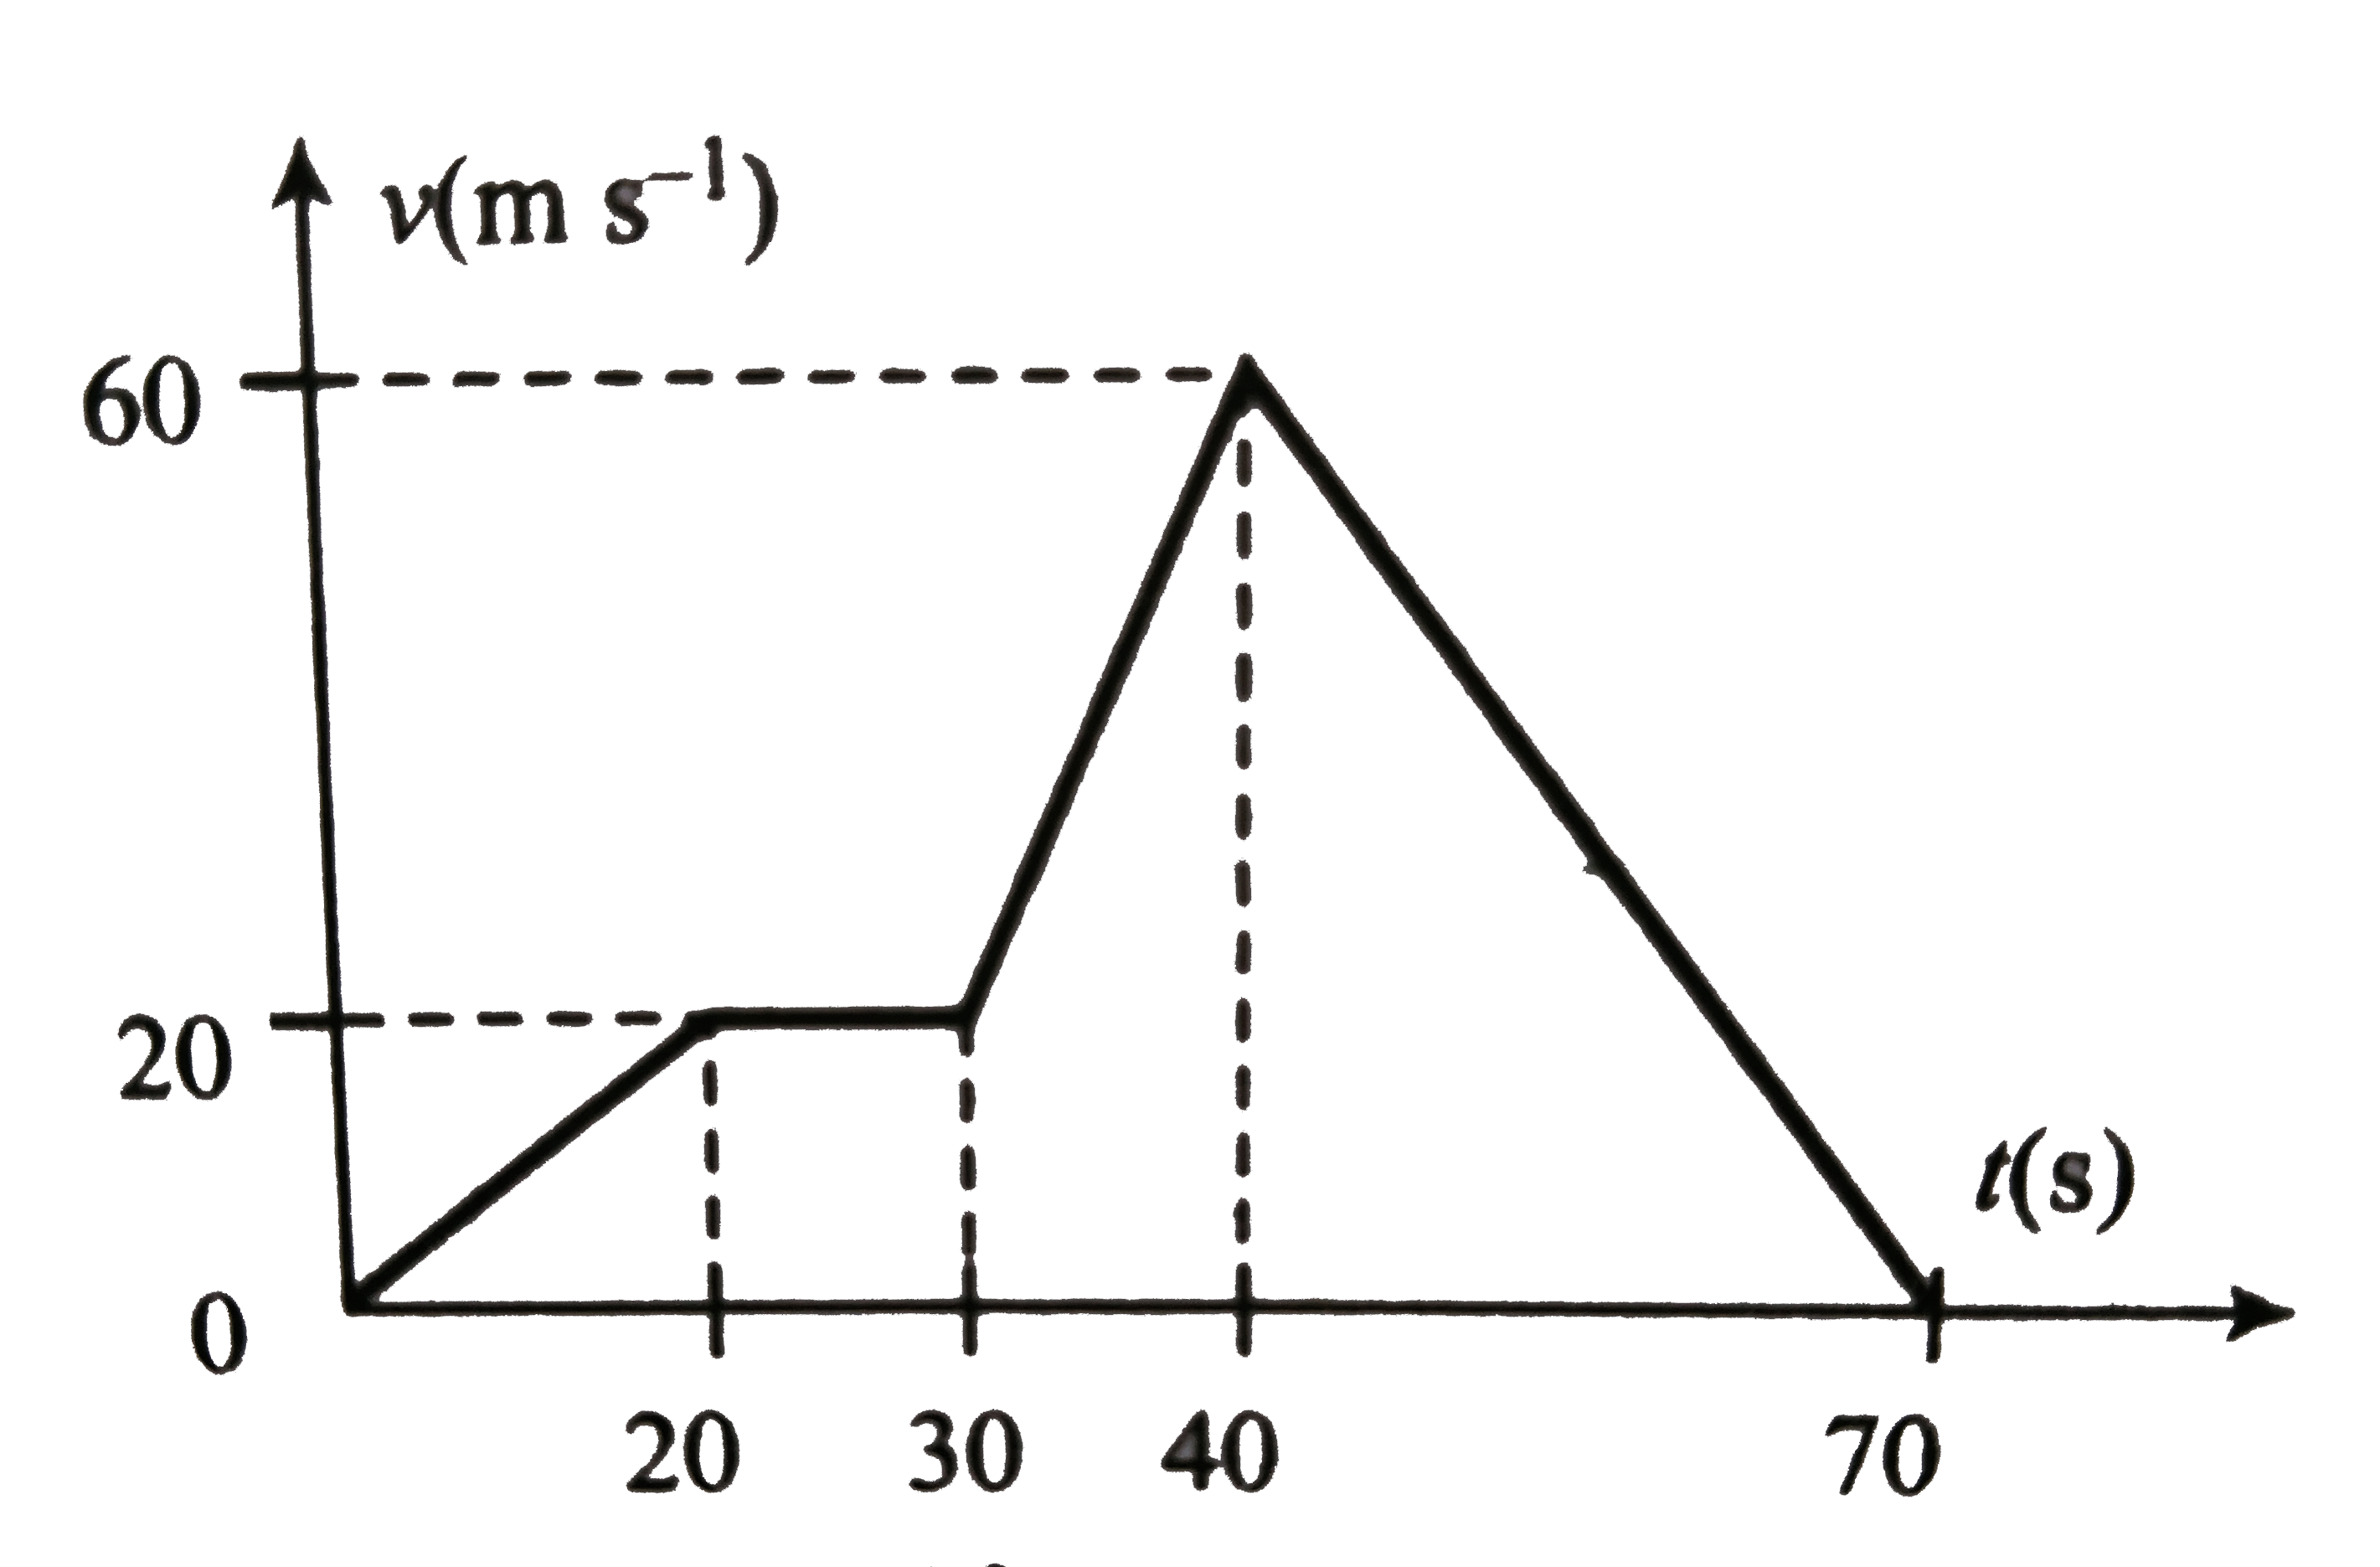
View SolutionThe velocity-time graph of a body is given in. The maximum acceleration in ms−1 is .
 .
.
View SolutionDraw the position-time graph of a moving object, moving with zero acceleration.
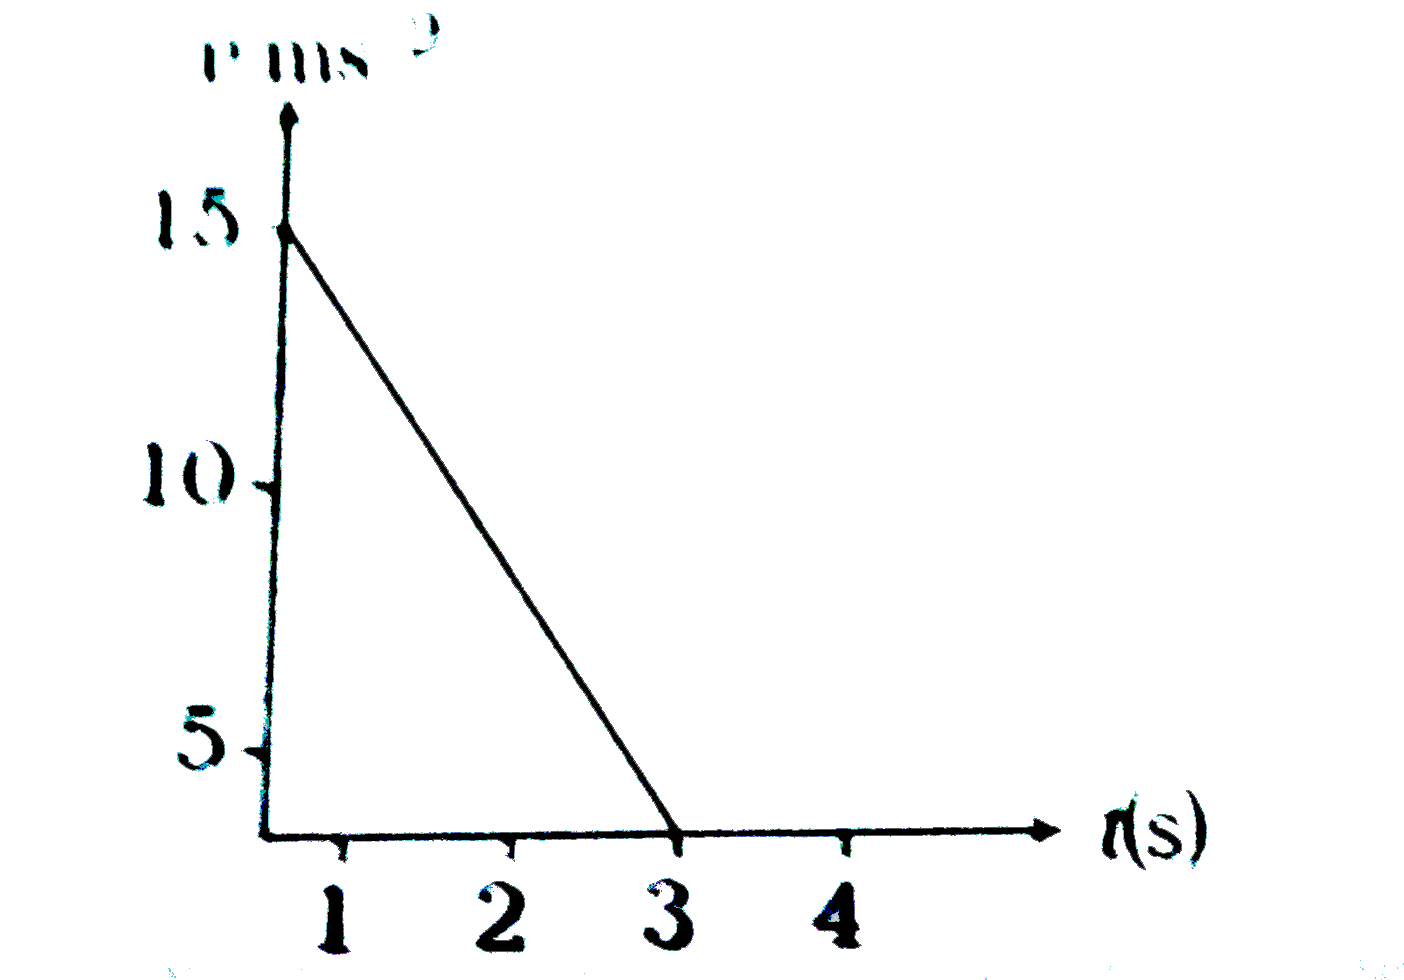
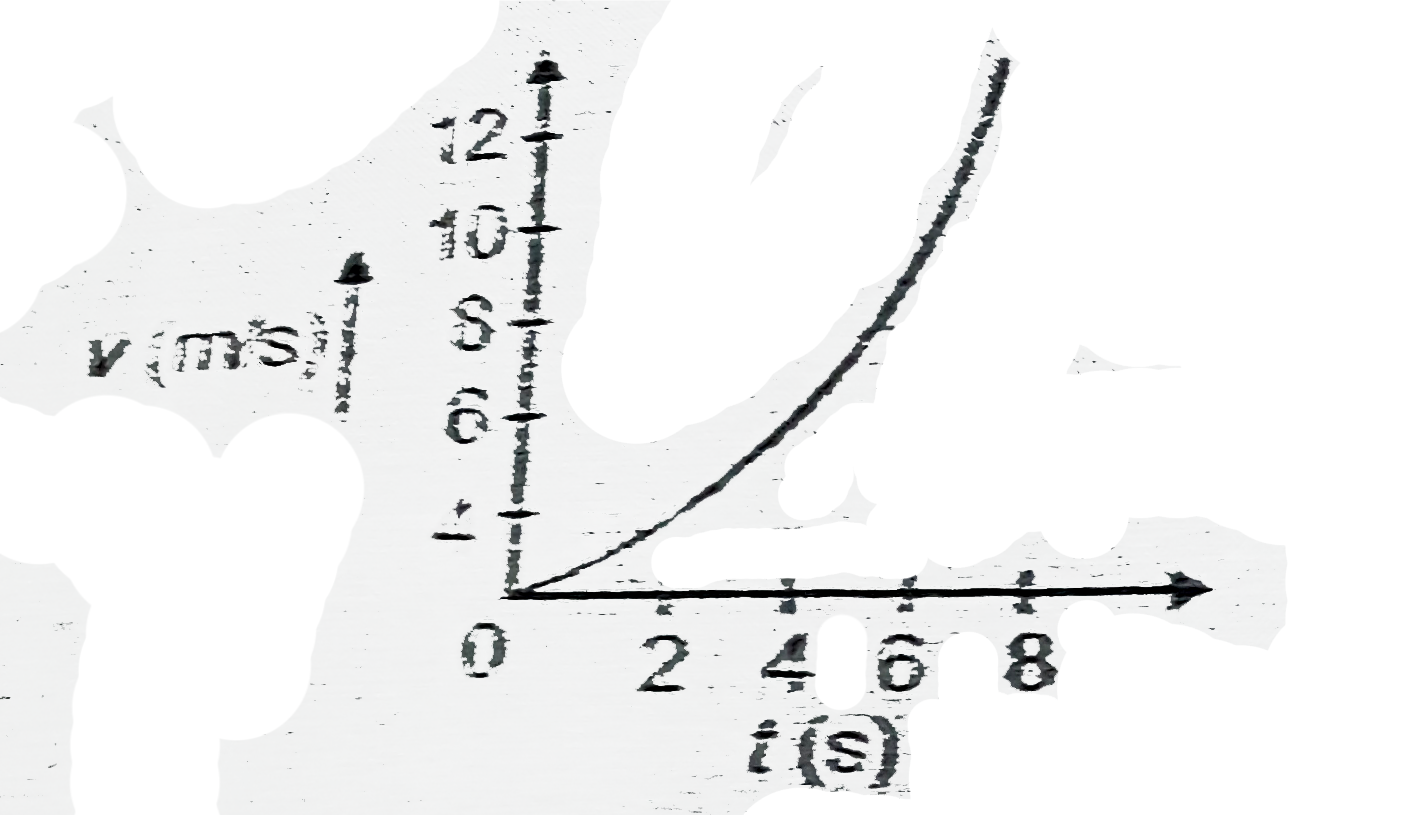
View SolutionThe velocity - time graph is shown in the figure, for a particle. The acceleration of particle is
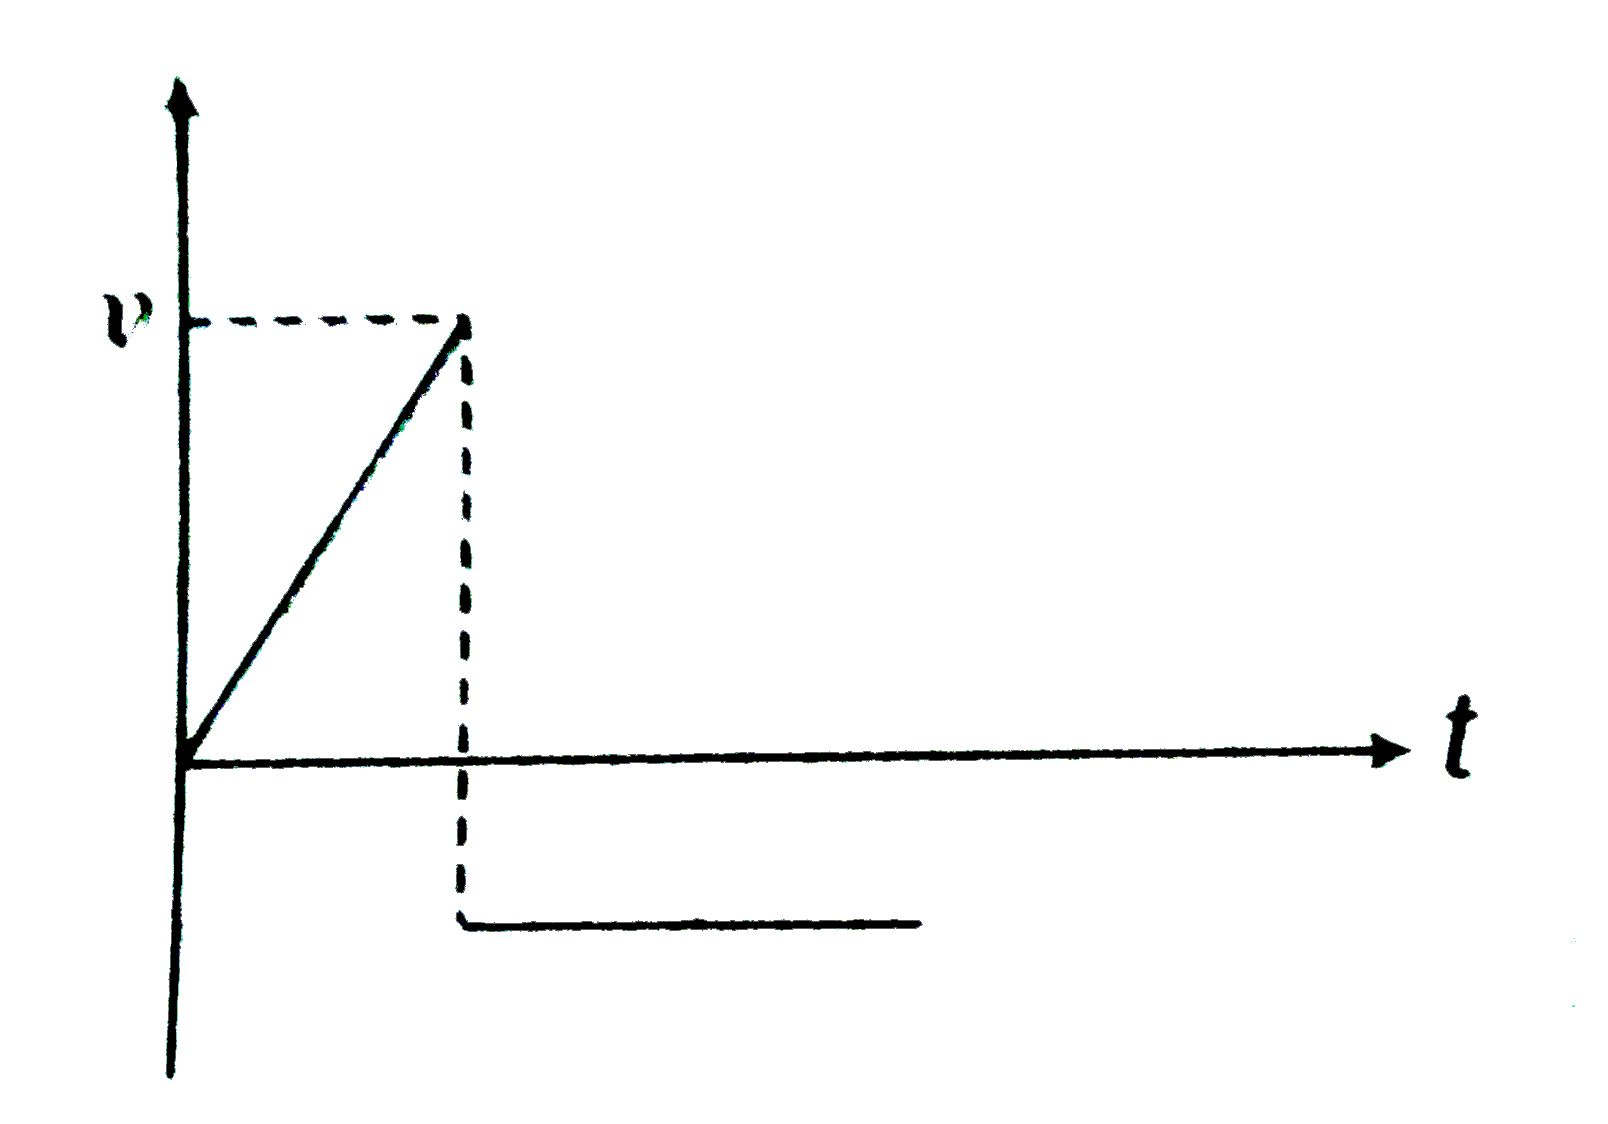
View SolutionThe velocity-time graph for a particle moving along X-axis is shown in the figure. The corresponding displacement-time graph is correctly shown by
View SolutionThe velocity-time graph of an object is given below. Calculate the average acceleration of the object in the time interval of 4 s to 6 s.
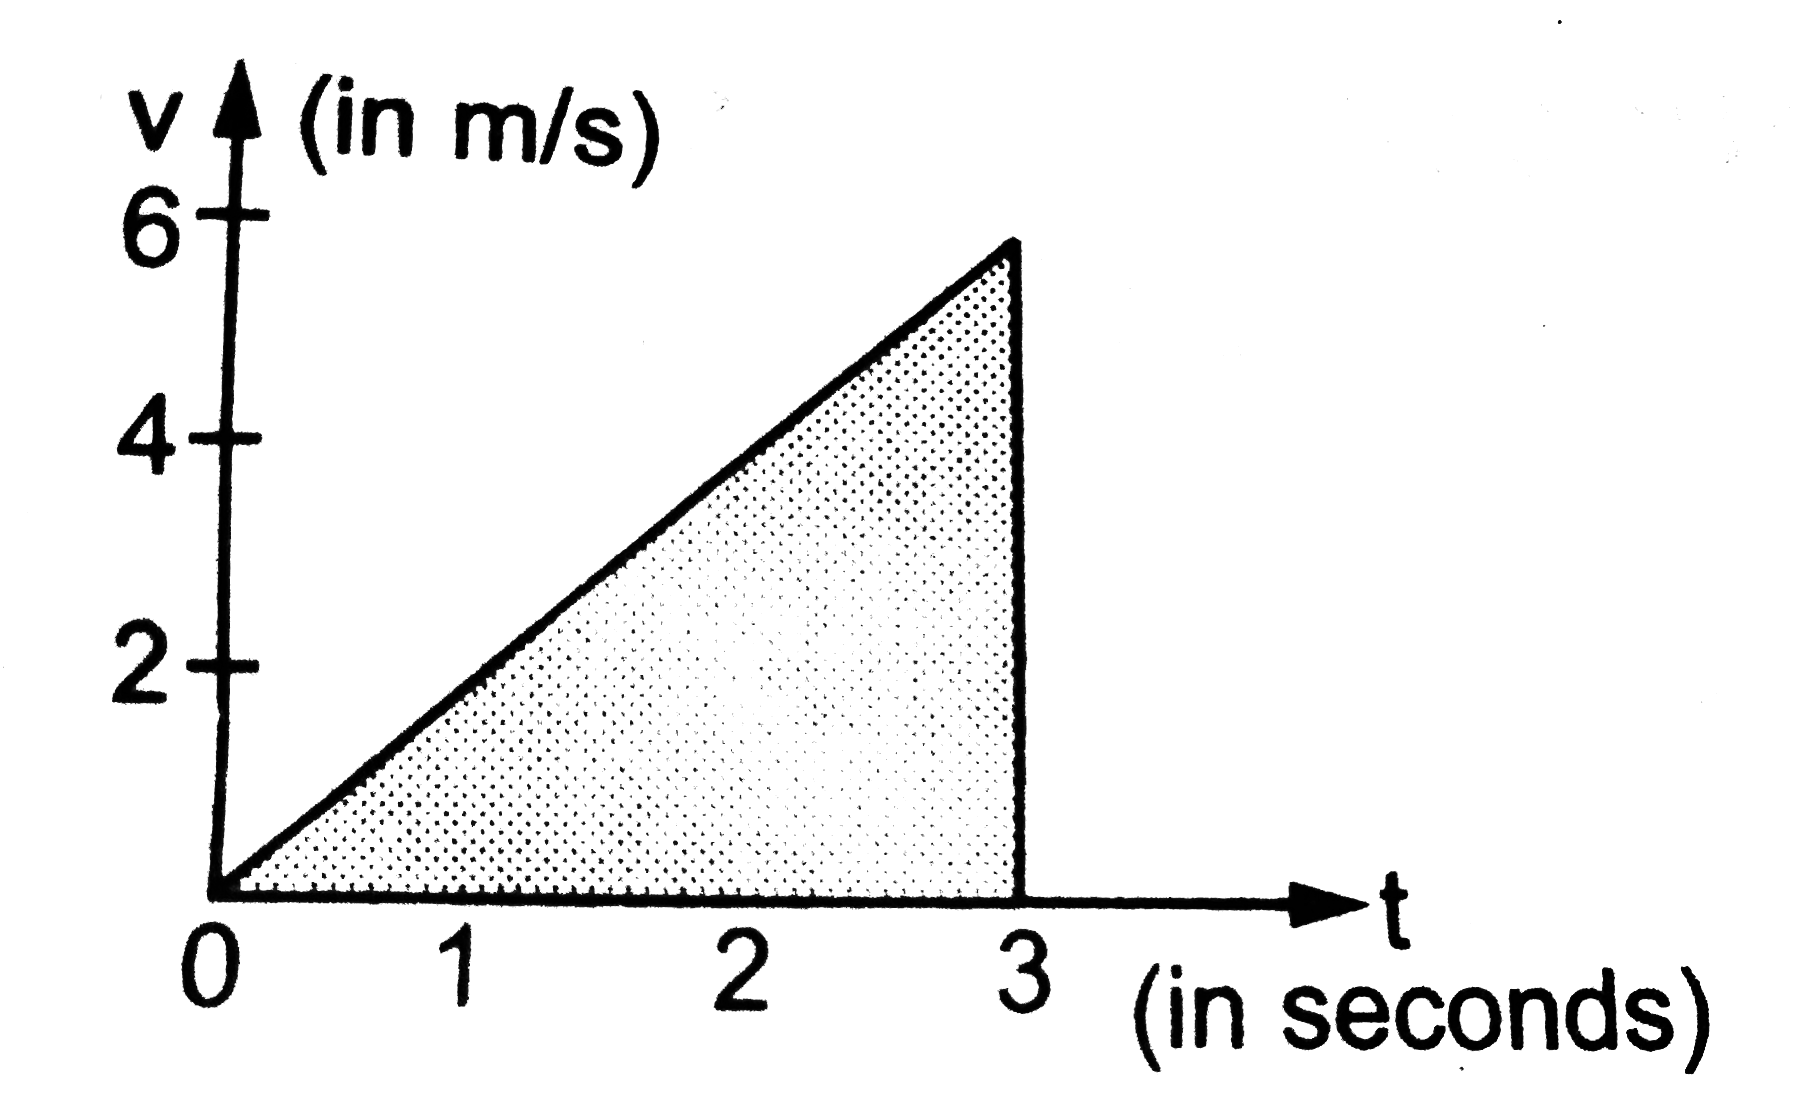
View SolutionFigure shows the speed versus time graph for a particle. Find the distance travelled by the particle during the time t=0 to t=3s.
View SolutionVelocity versus time graph of a body is shown in figure. It explains that
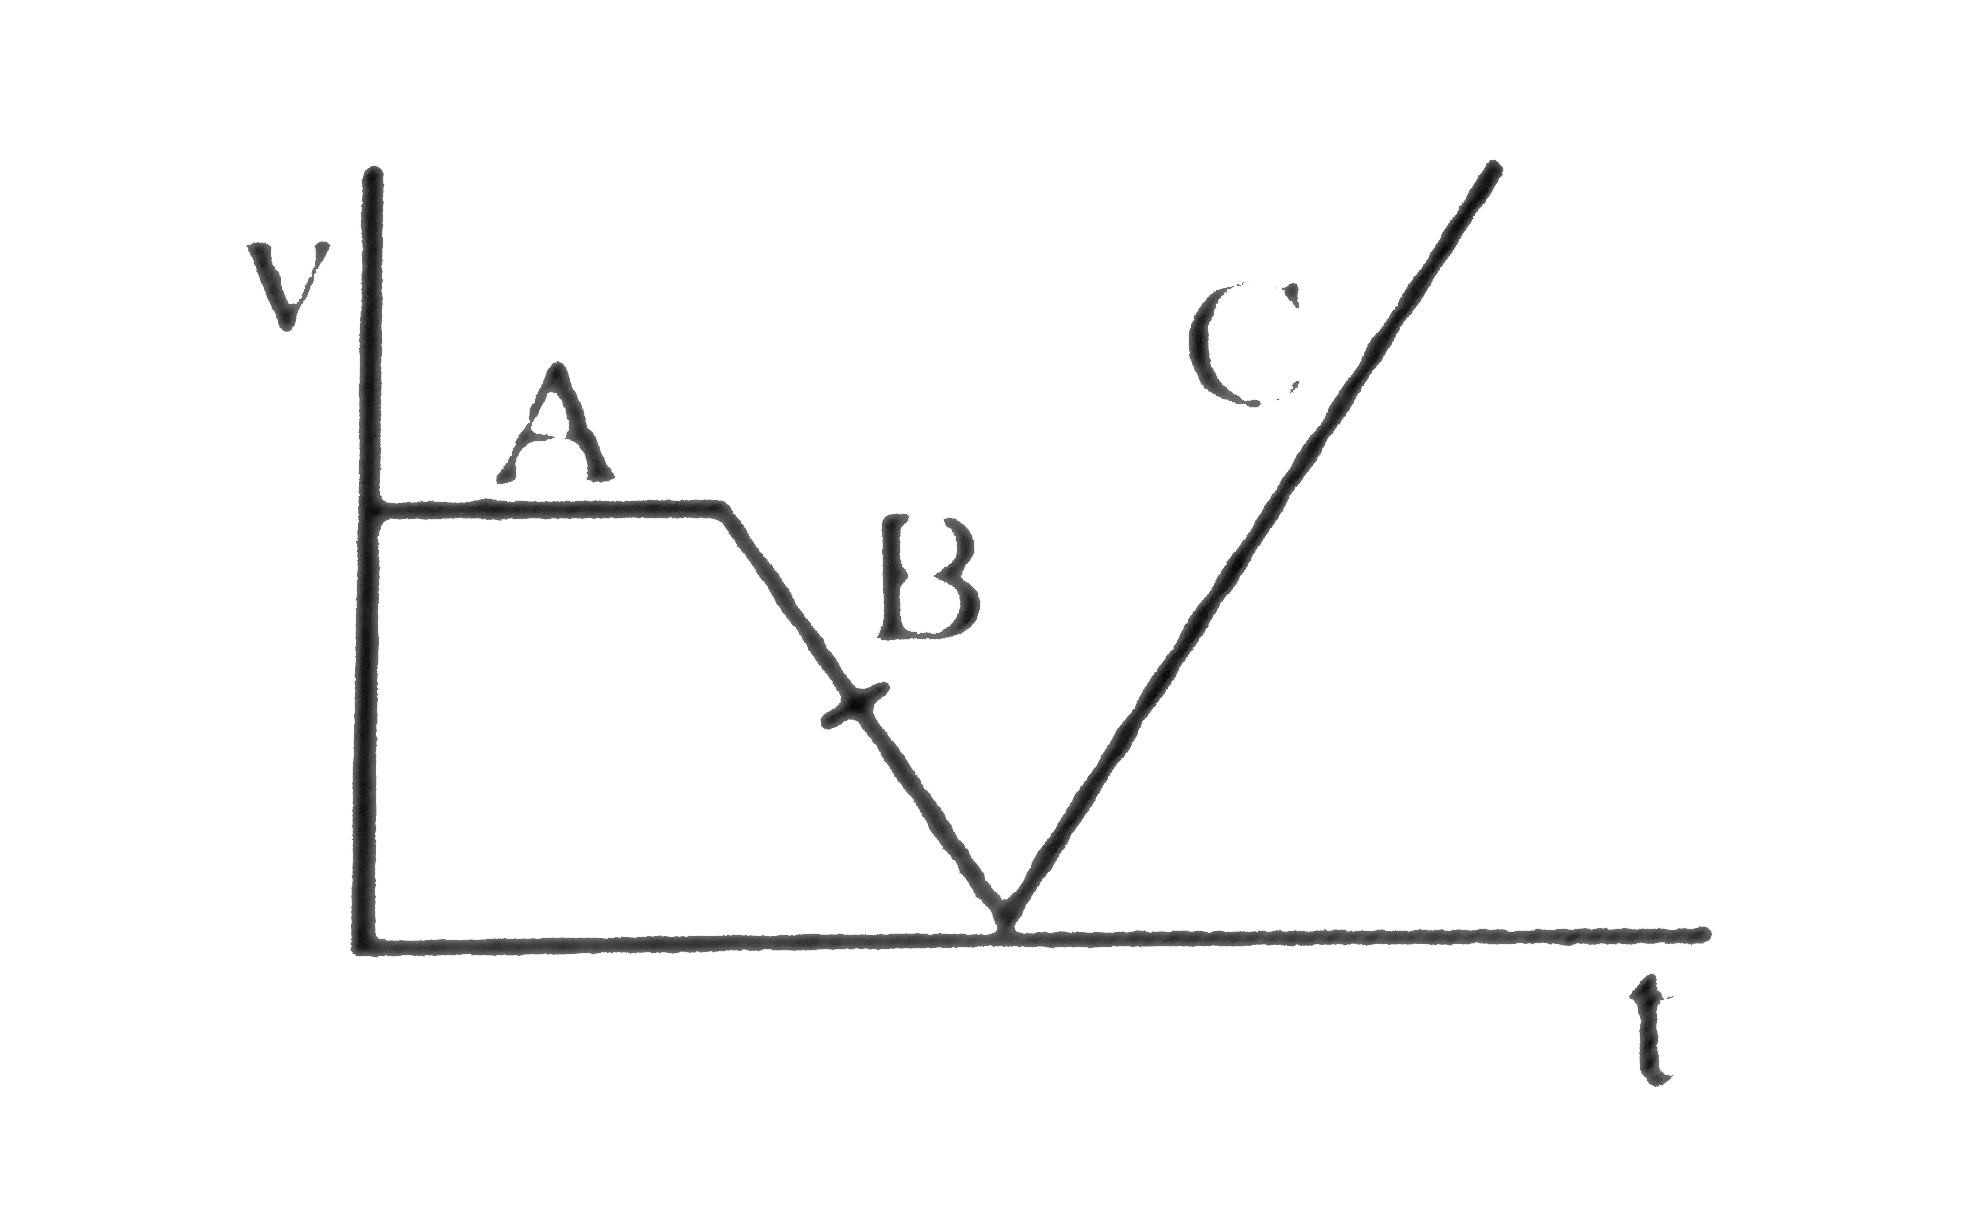
View SolutionVelocity-time graph for a moving object is shown in the figure. Total displacement of the object during the time interval when there is non-zero acceleration and retardation is.
View SolutionDraw a velocity-time graph for a body moving with an initial velocity u and uniform acceleration a. Use this graph to find the distance travelled by the body in time t.
View Solution
