S-t graph of two particles A and B shown in Fig. Find ratio of velocity of A to velocity of B
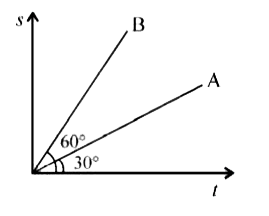
Velocity = Slope of s - t curve
So vAvB=Slope of ASlope of B=tan30∘tan60∘=13
Topper's Solved these Questions
- BOOK - ALLENCHAPTER - KINEMATICS (MOTION ALONG A STRAIGHT LINE AND MOTION IN A PLANE)EXERCISE - BEGINNER S BOX-69videos
KINEMATICS (MOTION ALONG A STRAIGHT LINE AND MOTION IN A PLANE)
- BOOK - ALLENCHAPTER - KINEMATICS (MOTION ALONG A STRAIGHT LINE AND MOTION IN A PLANE)EXERCISE - BEGINNER S BOX-78videos
KINEMATICS (MOTION ALONG A STRAIGHT LINE AND MOTION IN A PLANE)
- BOOK - ALLENCHAPTER - KINEMATICS (MOTION ALONG A STRAIGHT LINE AND MOTION IN A PLANE)EXERCISE - BEGINNER S BOX-46videos
KINEMATICS (MOTION ALONG A STRAIGHT LINE AND MOTION IN A PLANE)
- BOOK - ALLENCHAPTER - KINEMATICSEXERCISE - EXERCISE-289videos
KINEMATICS
- BOOK - ALLENCHAPTER - MISCELLANEOUSEXERCISE - Question1videos
MISCELLANEOUS
Similar Questions
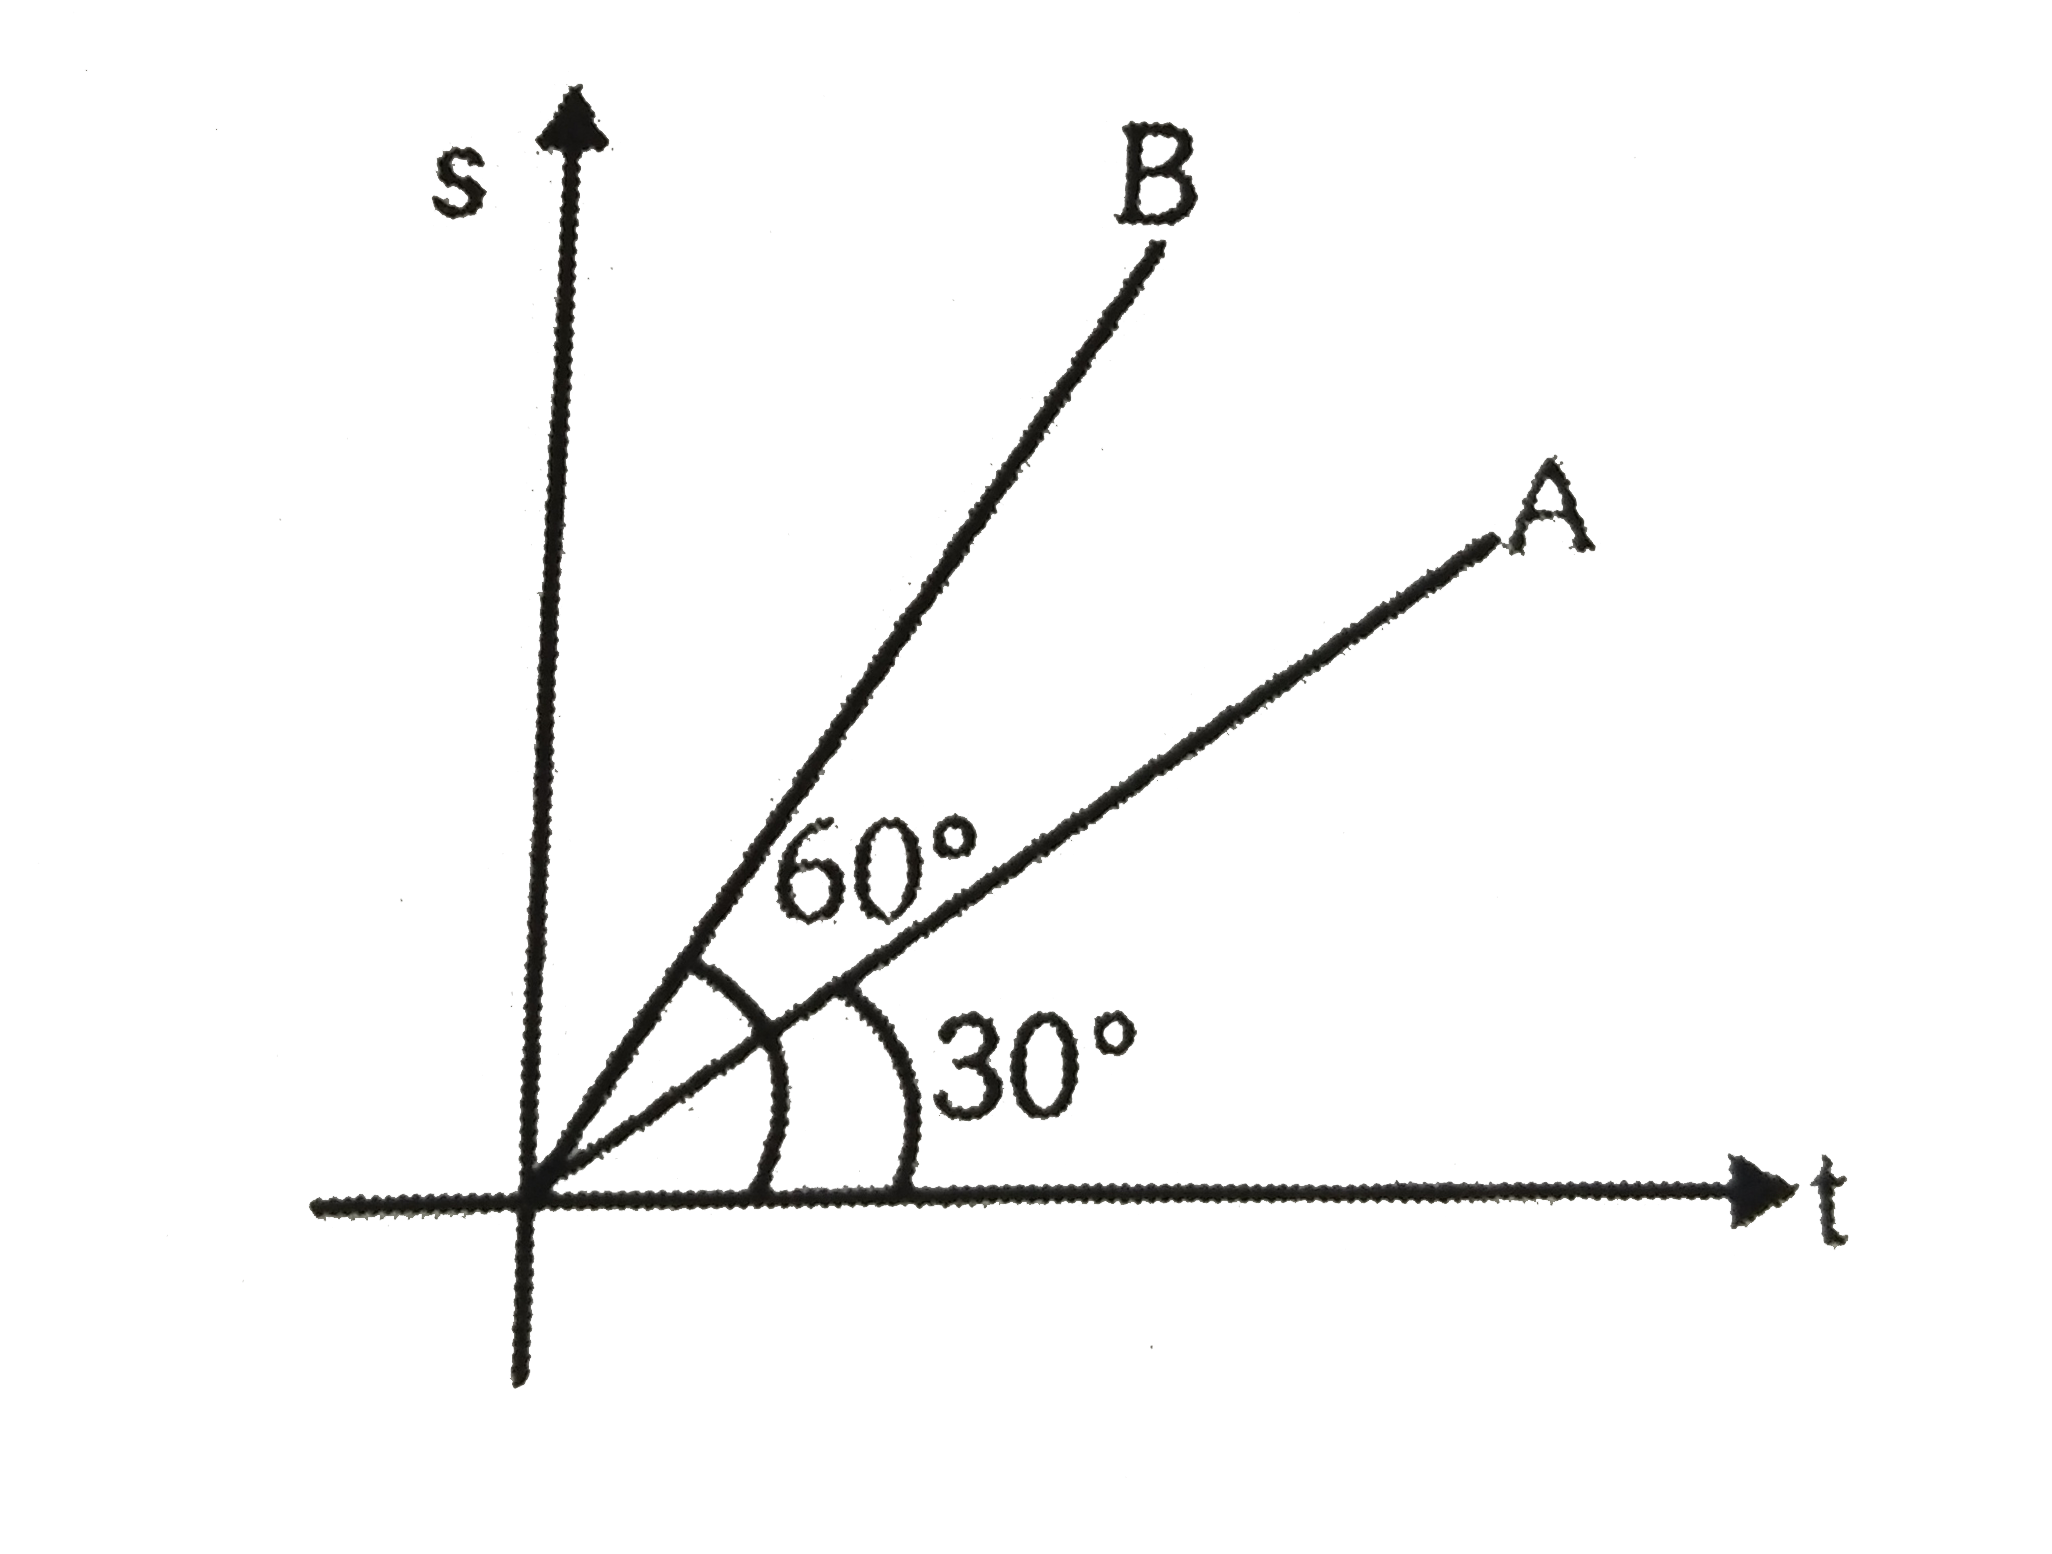
s-t graph of two particles A and B are shown in fig. Find the ratio of velocity of A to velocity of B.
 View Solution
The displacement time graphs of two bodies A and B are shown in figure. The ratio of velocity of A to velocity of B,vA/vB is:
 View Solution
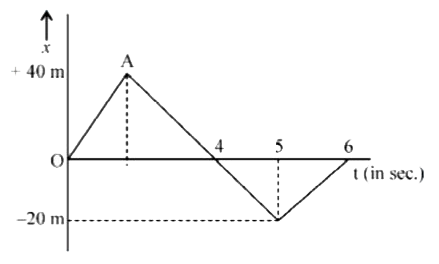
s-t graph of a particle in motion is shown in Fig. Calculate Average velocity
View SolutionThe displacement-time graphs of two particles P and Q are as shown in the figure. The ratio of their velocities VP and VQ will be
 View Solution
s-t graph of a particle in motion is shown in Fig. Calculate
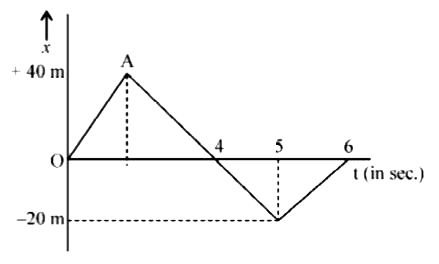
DisplacementView Solutions-t graph of a particle in motion is shown in Fig. Calculate
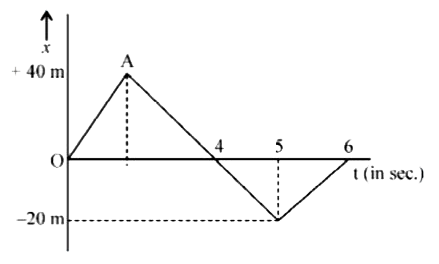
Average speedView SolutionThe acceleration time graph of a particle is shown in the Fig. 2 (CF). 11. At time t=0s velocity of the particle is 8ms−1. Its velocity t=10s is.
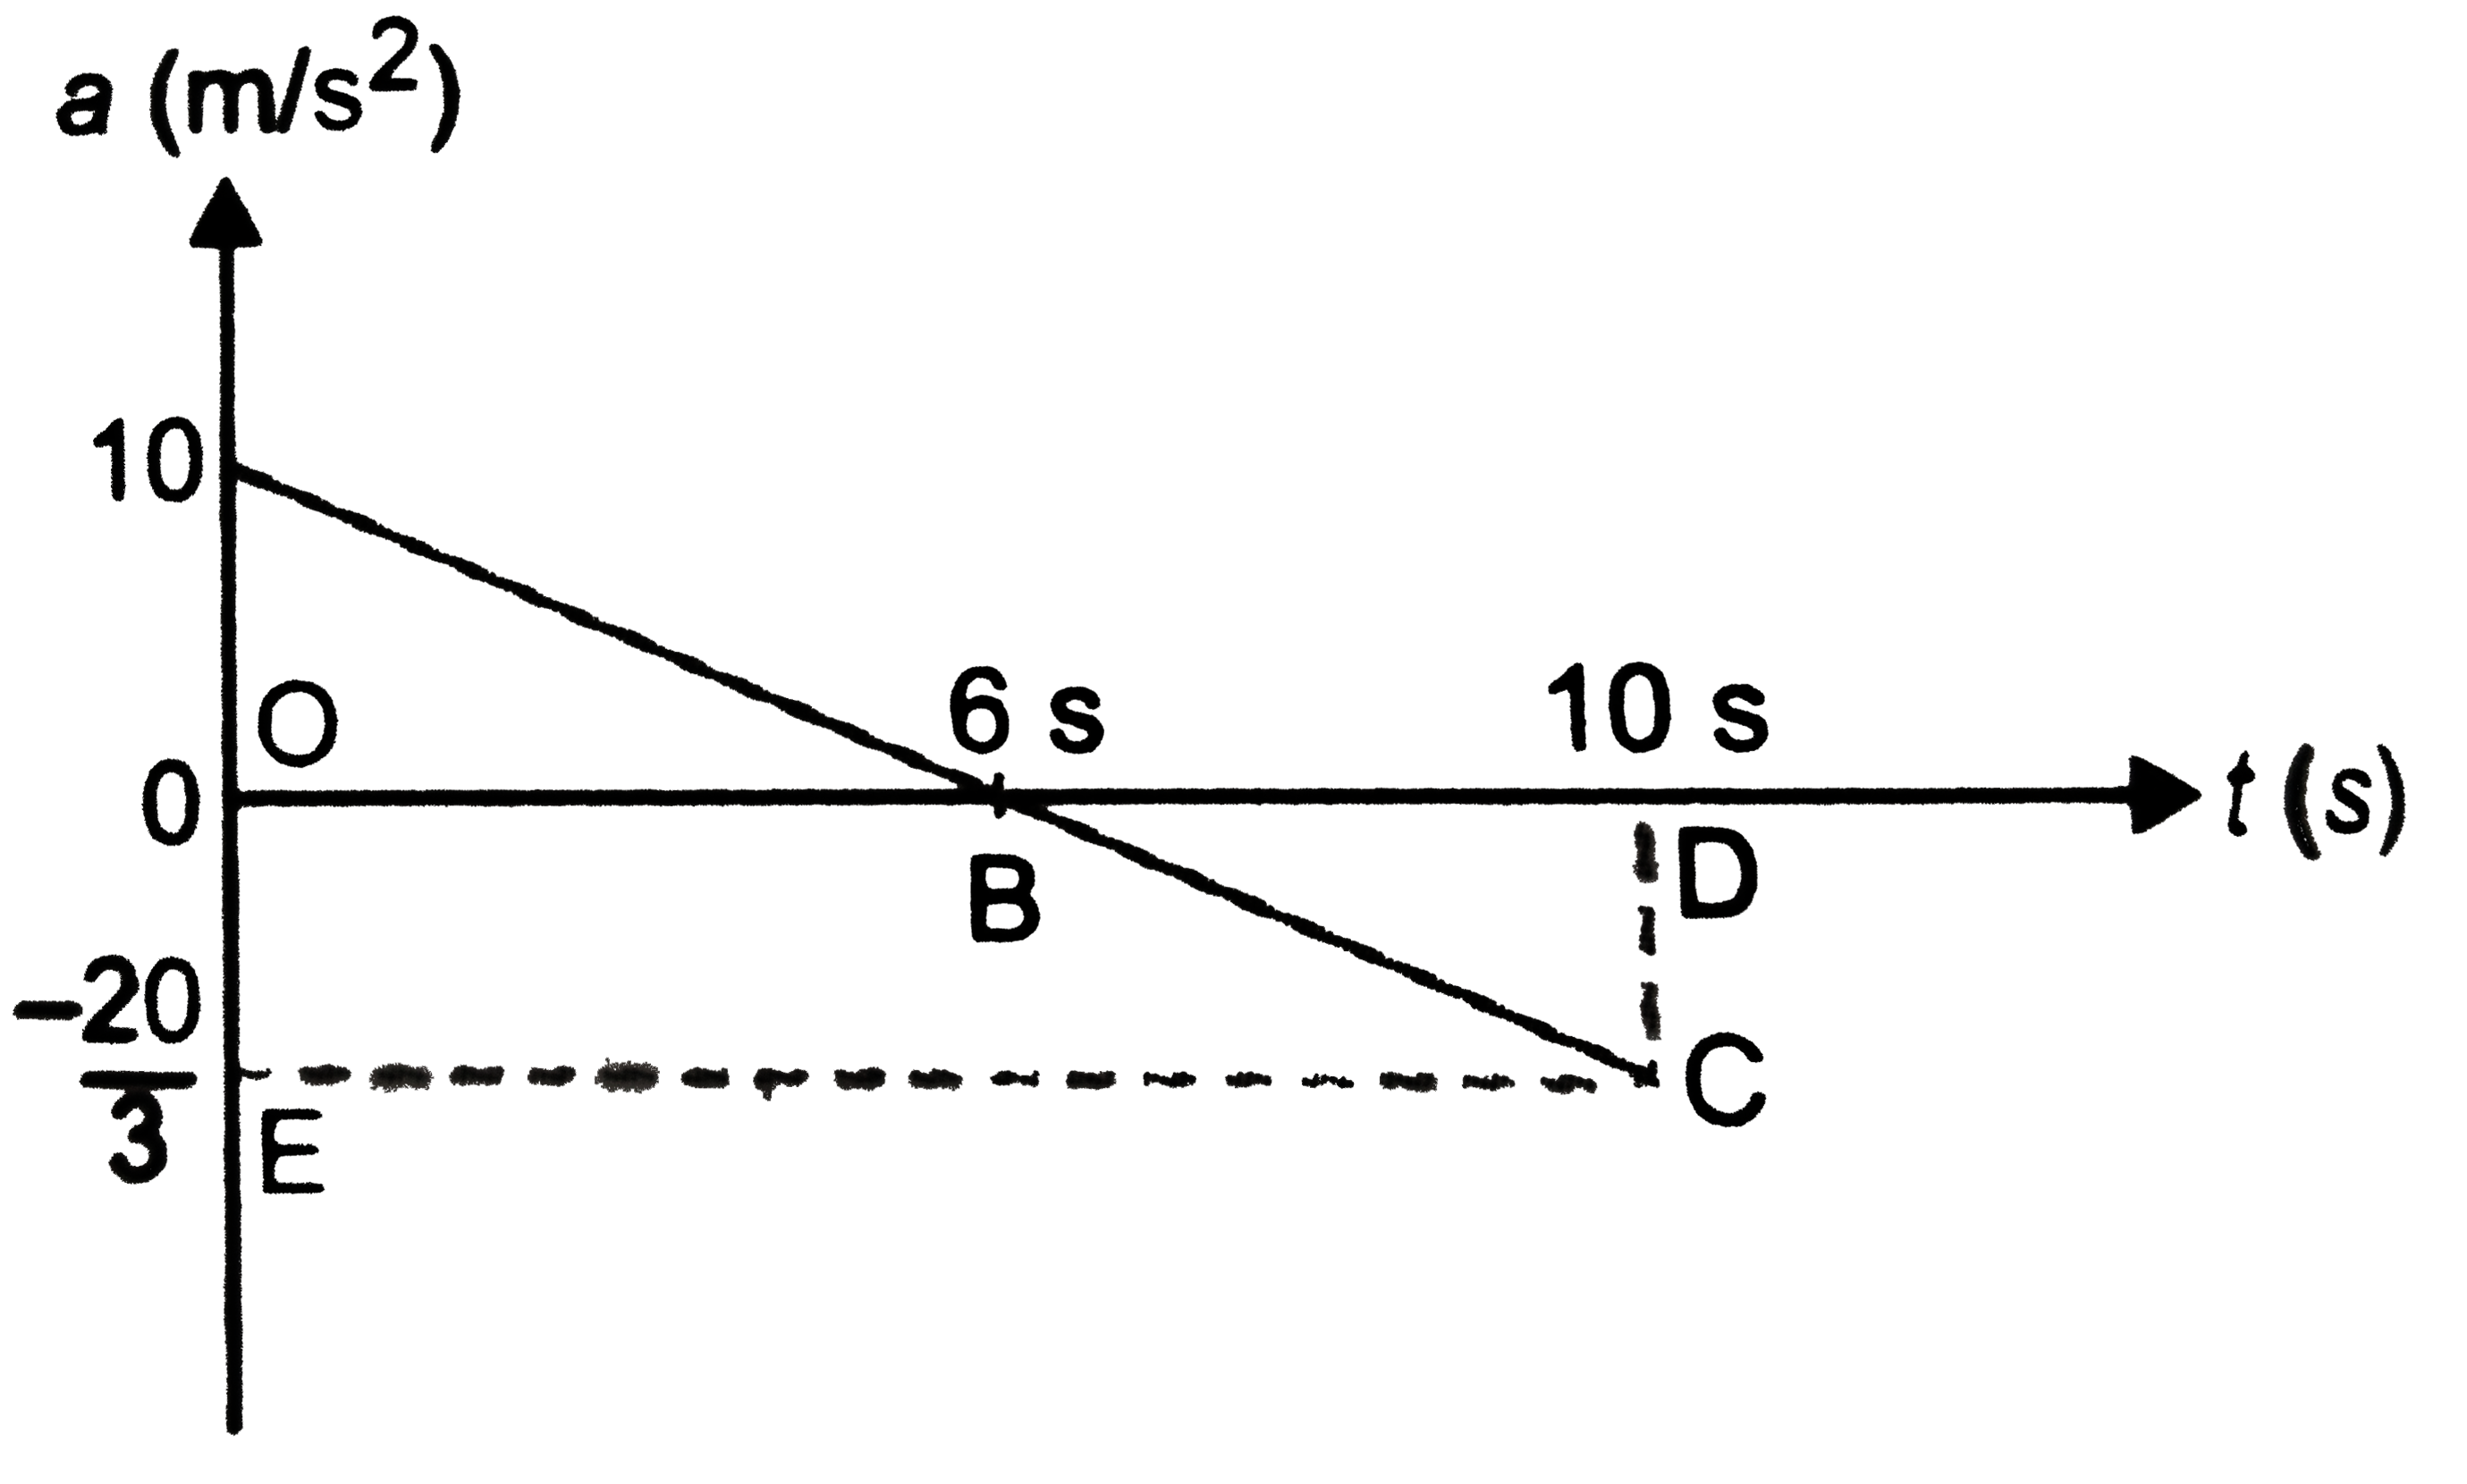 .View Solution
Assertion : In displacement-time graph of a particle as shown in figure, velocity of particle changes its direction at point A.

Reason : Sign of slope of s-t graph decides the direction of velocity.View SolutionThe velocity − time graph of a particle is as shown in figure
 View Solution
The velocity - time graph for two bodies A and B are shown in figure. Then, the acceleration of A and B are in the ratio
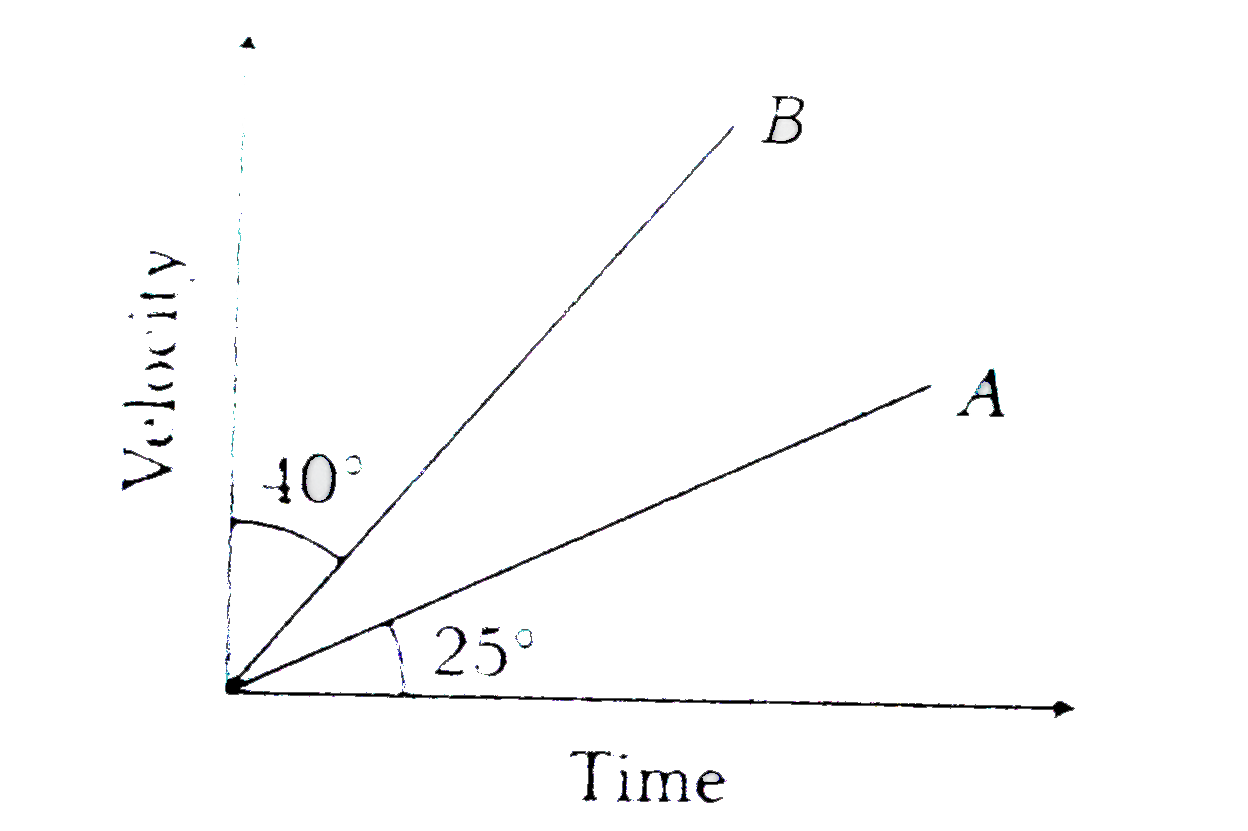 View Solution

