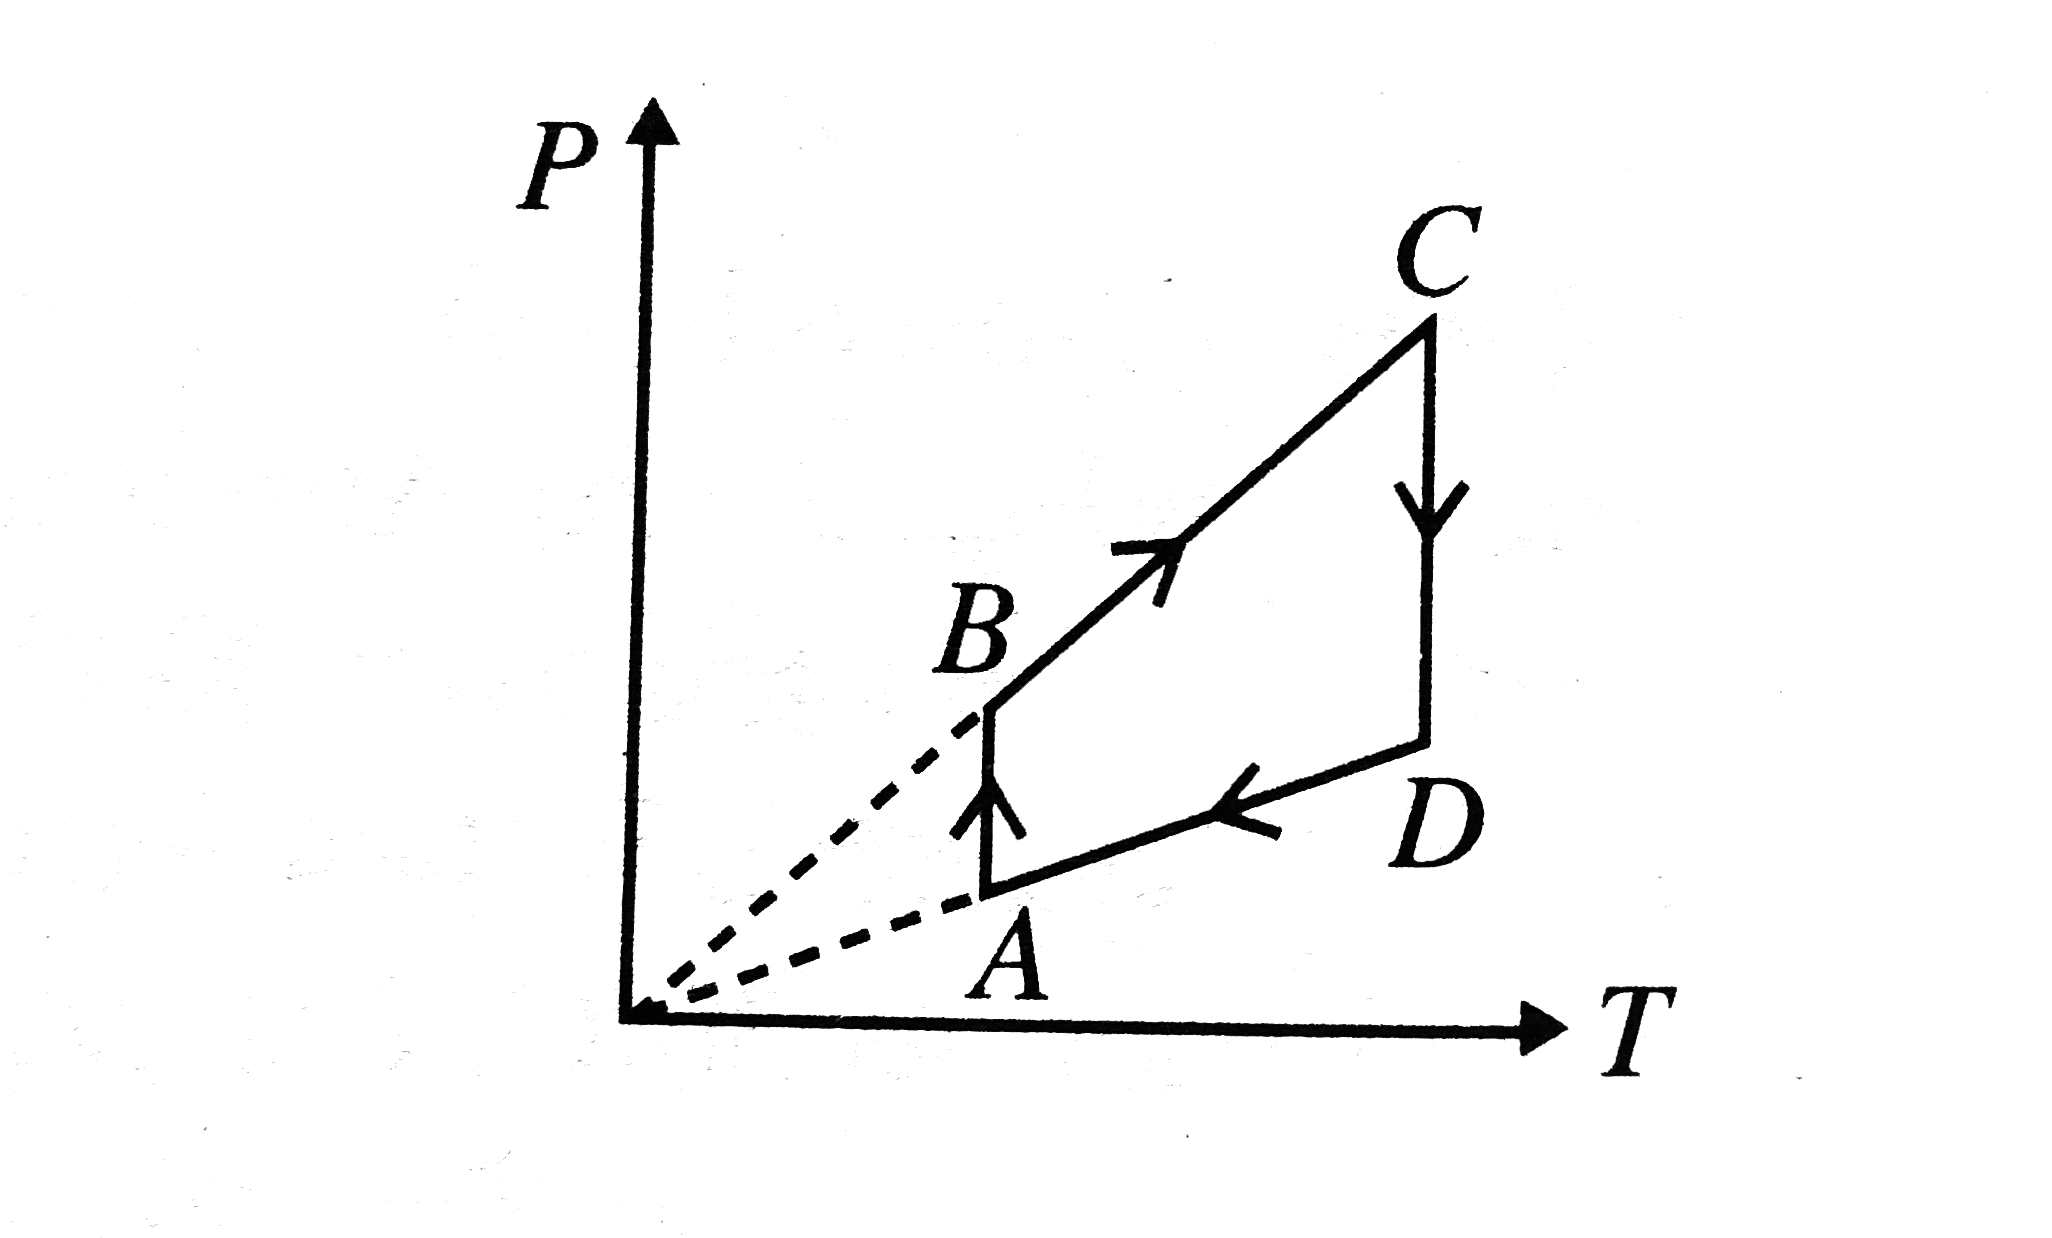
Pressure versus temperature graph of an ideal gas of equal number of an ideal gas of equal number of mole of defferent volumes are platted as shown in figure. Choose the correct alternative.
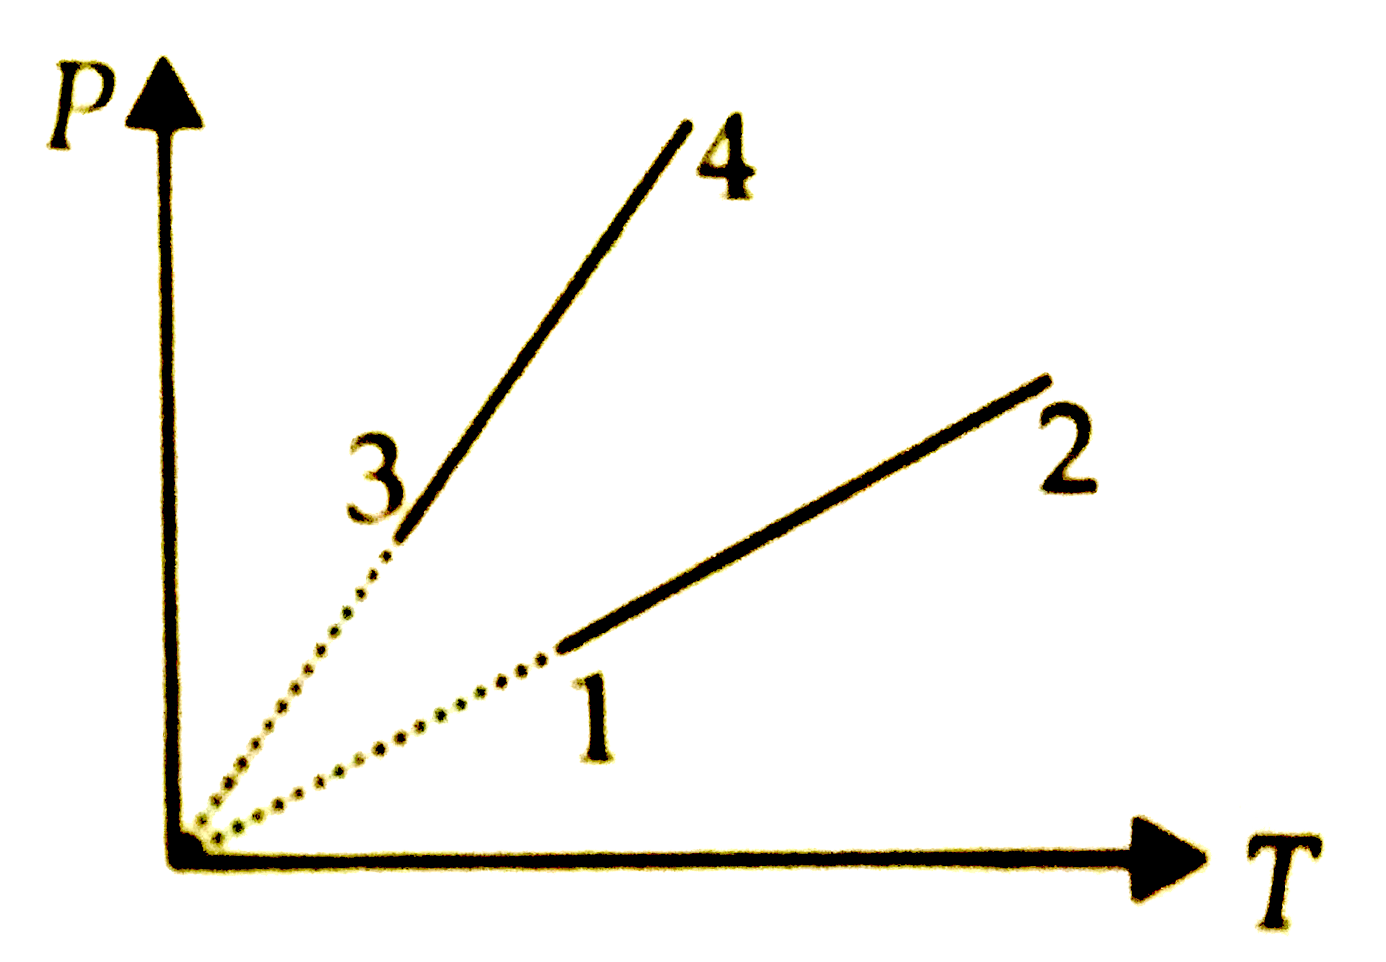
C corresponds to 'H_(2)', B to He and A to O2
A corresponds to H2, B to He and C to O2
A corresponds to He, B to O2 and C to H2
A corresponds to O2, B to H2 and C to He
The correct Answer is:A
Step by step video & image solution for Pressure versus temperature graph of an ideal gas of equal number of an ideal gas of equal number of mole of defferent volumes are platted as shown in figure. Choose the correct alternative. by Physics experts to help you in doubts & scoring excellent marks in Class 12 exams.
Updated on:21/07/2023Topper's Solved these Questions
- RACEBOOK - ALLENCHAPTER - RACEEXERCISE - Basic Maths (Thermal Physics) (Thermodynamic process)
20 Videos
- RACEBOOK - ALLENCHAPTER - RACEEXERCISE - Basic Maths (Dscillations) (Kinematics of SHM)
20 Videos
- RACEBOOK - ALLENCHAPTER - RACEEXERCISE - Basic Maths (Thermal Physics) (Mode of Heat Transfer)
14 Videos
- NEWTONS LAWS OF MOTIONBOOK - ALLENCHAPTER - NEWTONS LAWS OF MOTIONEXERCISE - EXERCISE-III
28 Videos
- SIMPLE HARMONIC MOTIONBOOK - ALLENCHAPTER - SIMPLE HARMONIC MOTIONEXERCISE - Example
1 Videos
Similar Questions
Pressure versus temperature graph of an ideal gas of equal number of moles of different volumes is plotted as shown in Fig. Choose the correct alternative.
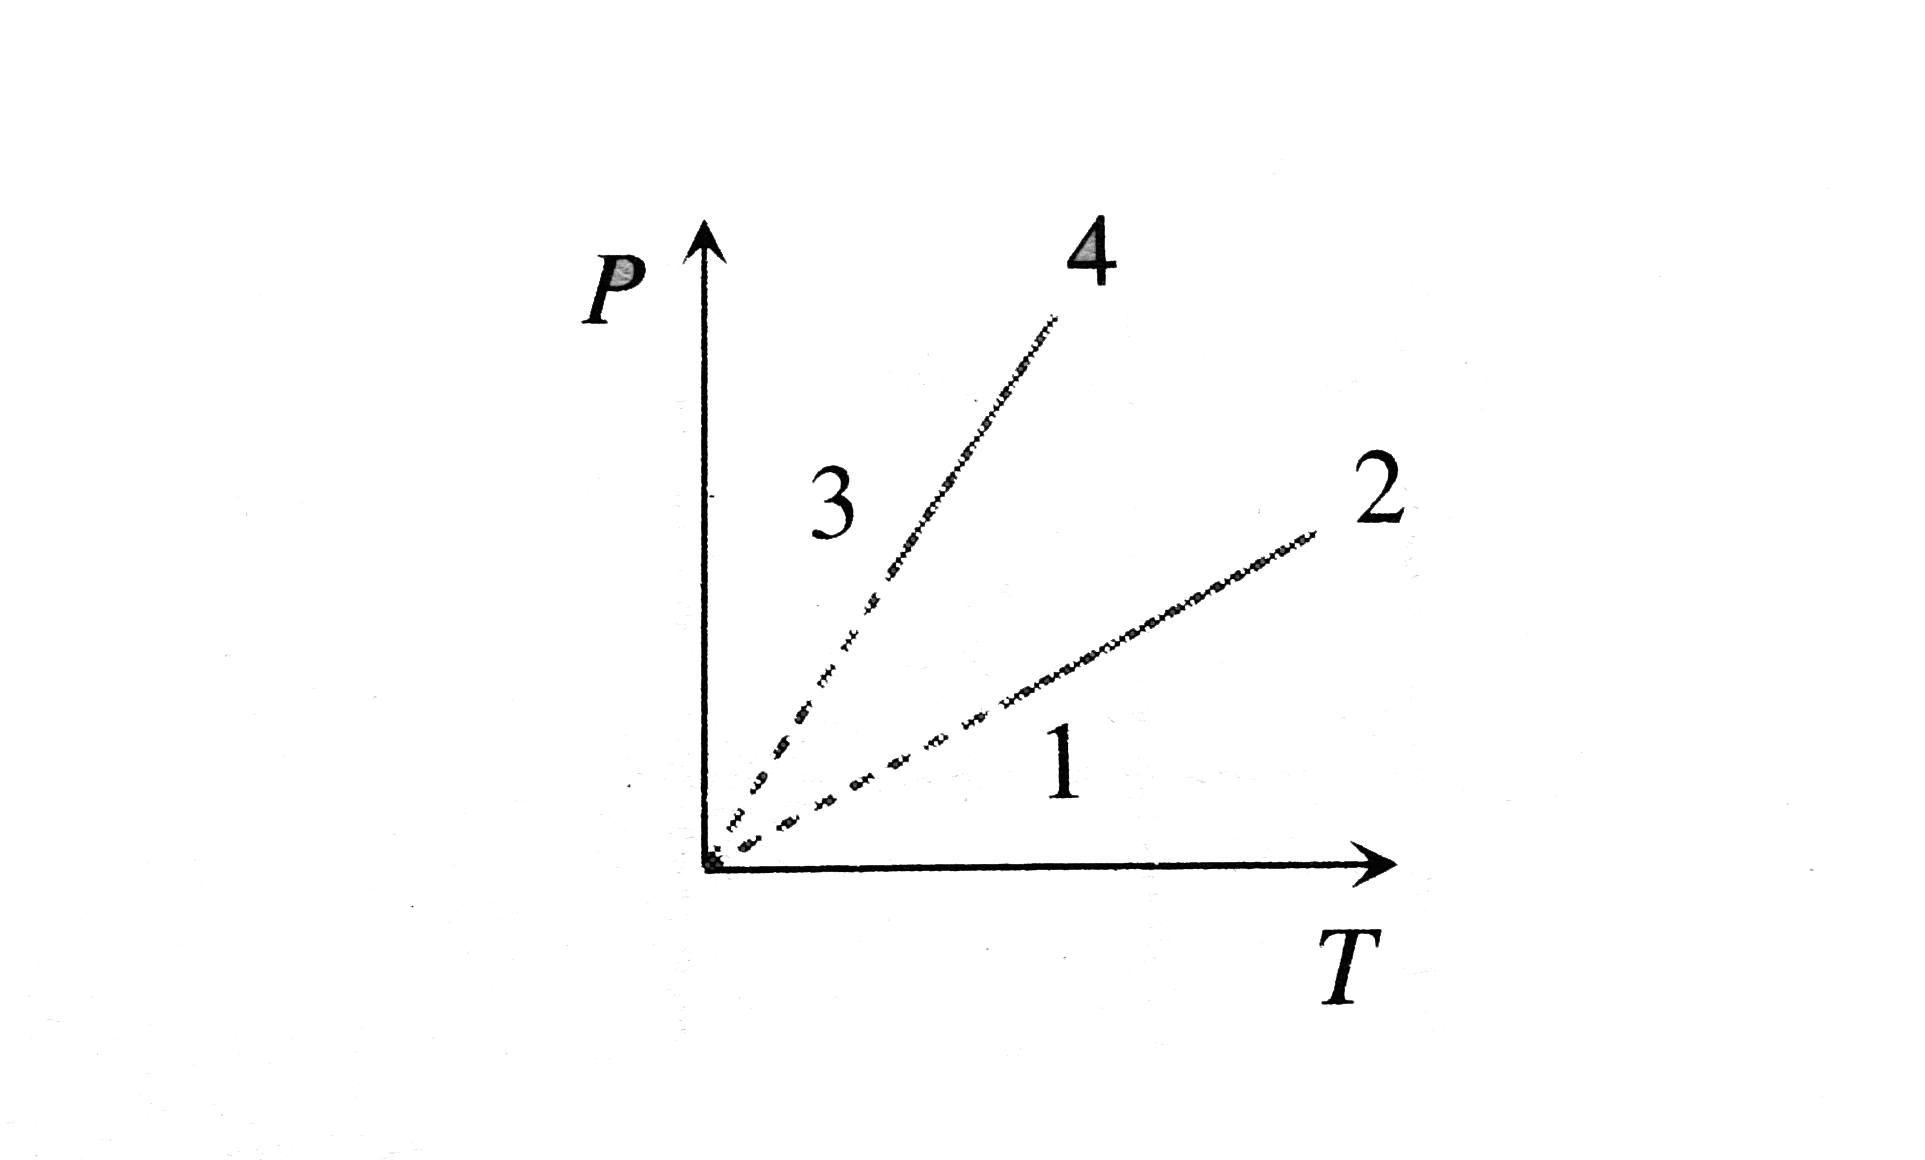
View SolutionVolume versus temperature (V-T) graph of an ideal gas of equal number of moles is plotted as shown in the figure. Choose the correct alternative.
View Solution
Knowledge Check
Pressure versus temperature graph of an ideal gas of equal number of moles of different volumes is plotted as shown in Fig. Choose the correct alternative.
 AV1=V2=V3=V4BV4>V3>V2>V1CV1=V2,V3=V4andV2>V3DV1=V2,V3=V4andV2<V3
Pressure versus density graph of an ideal gas is shown in figure
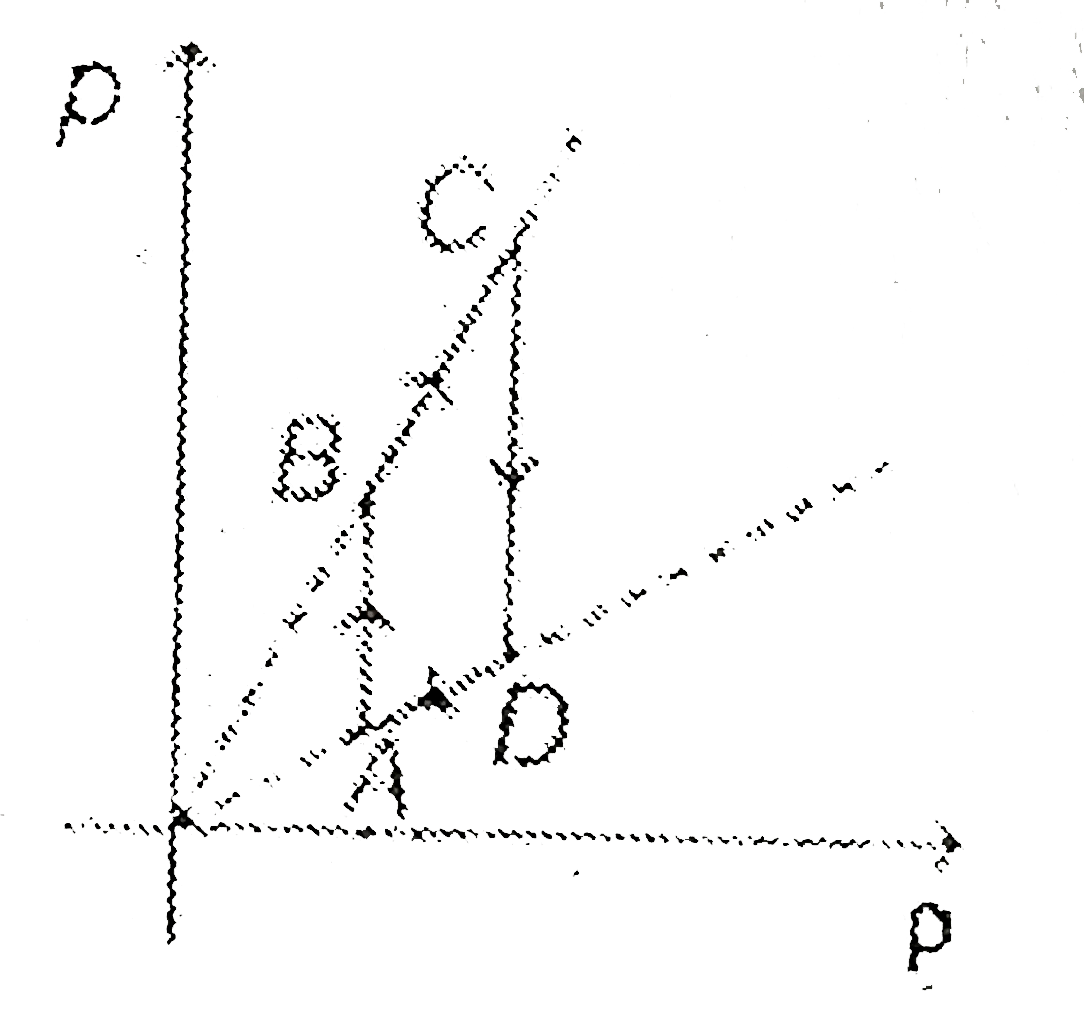
View SolutionPressure versus temperature graphs of an ideal gas are as shown in figure. Choose the wrong statement
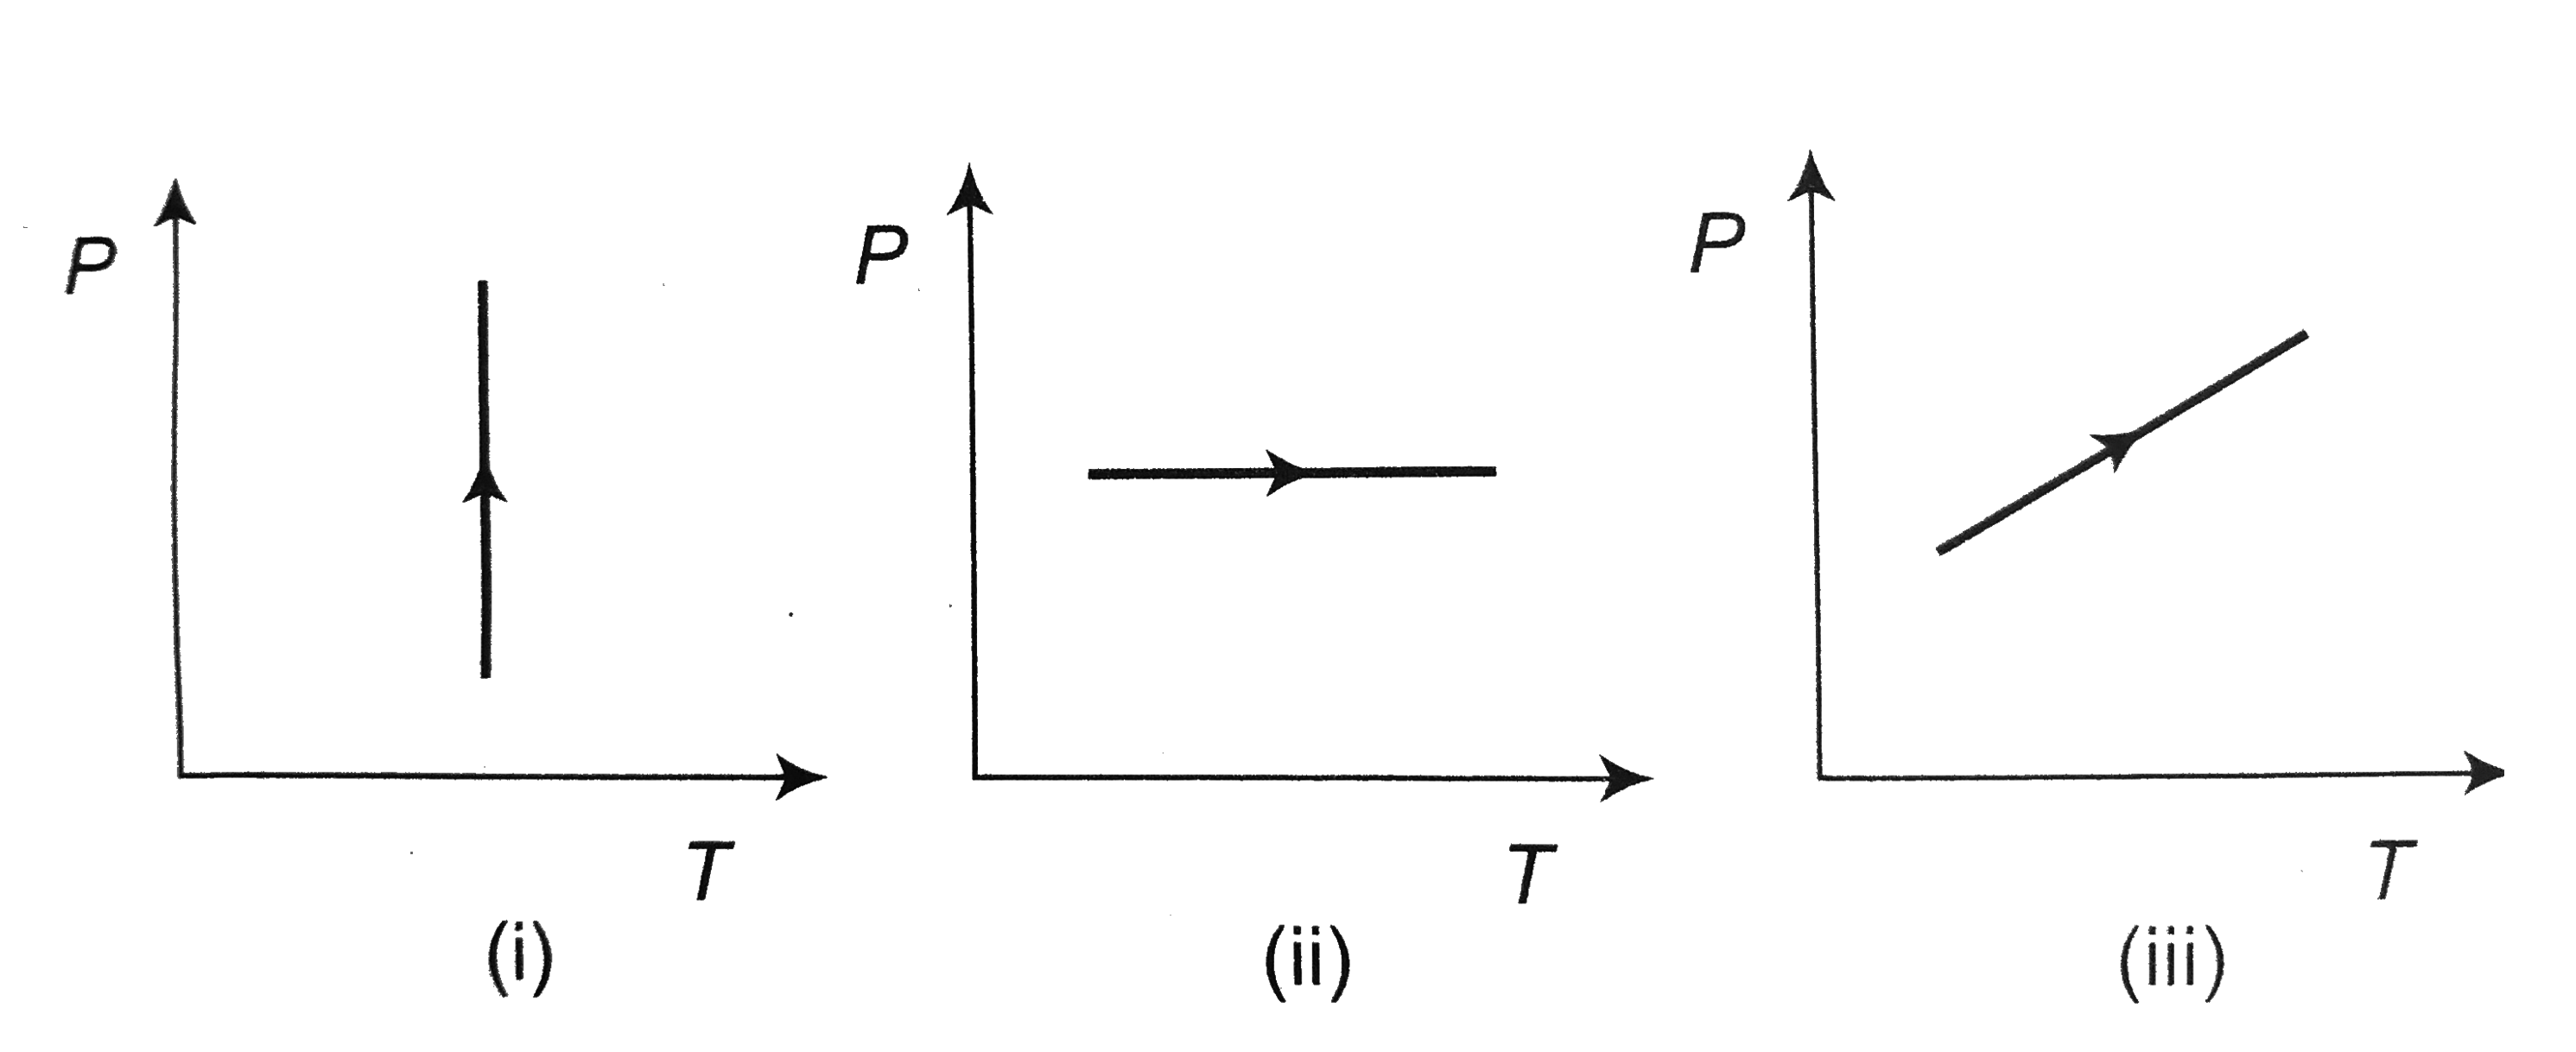
View SolutionPressure versus temperature graphs of an ideal gas are as shown in figure. Choose the wrong statement

View SolutionIf pressure and temperature of an ideal gas are doubled and volume is halved, the number of molecules of the gas
View SolutionPressure versus temperature graph of an ideal gas as shown in Fig.
Corresponding density (ρ) versus volume (V) graph will be
View SolutionPressure versus temperature graph of an ideal gas as shown in Fig.
Corresponding density (ρ) versus volume (V) graph will be

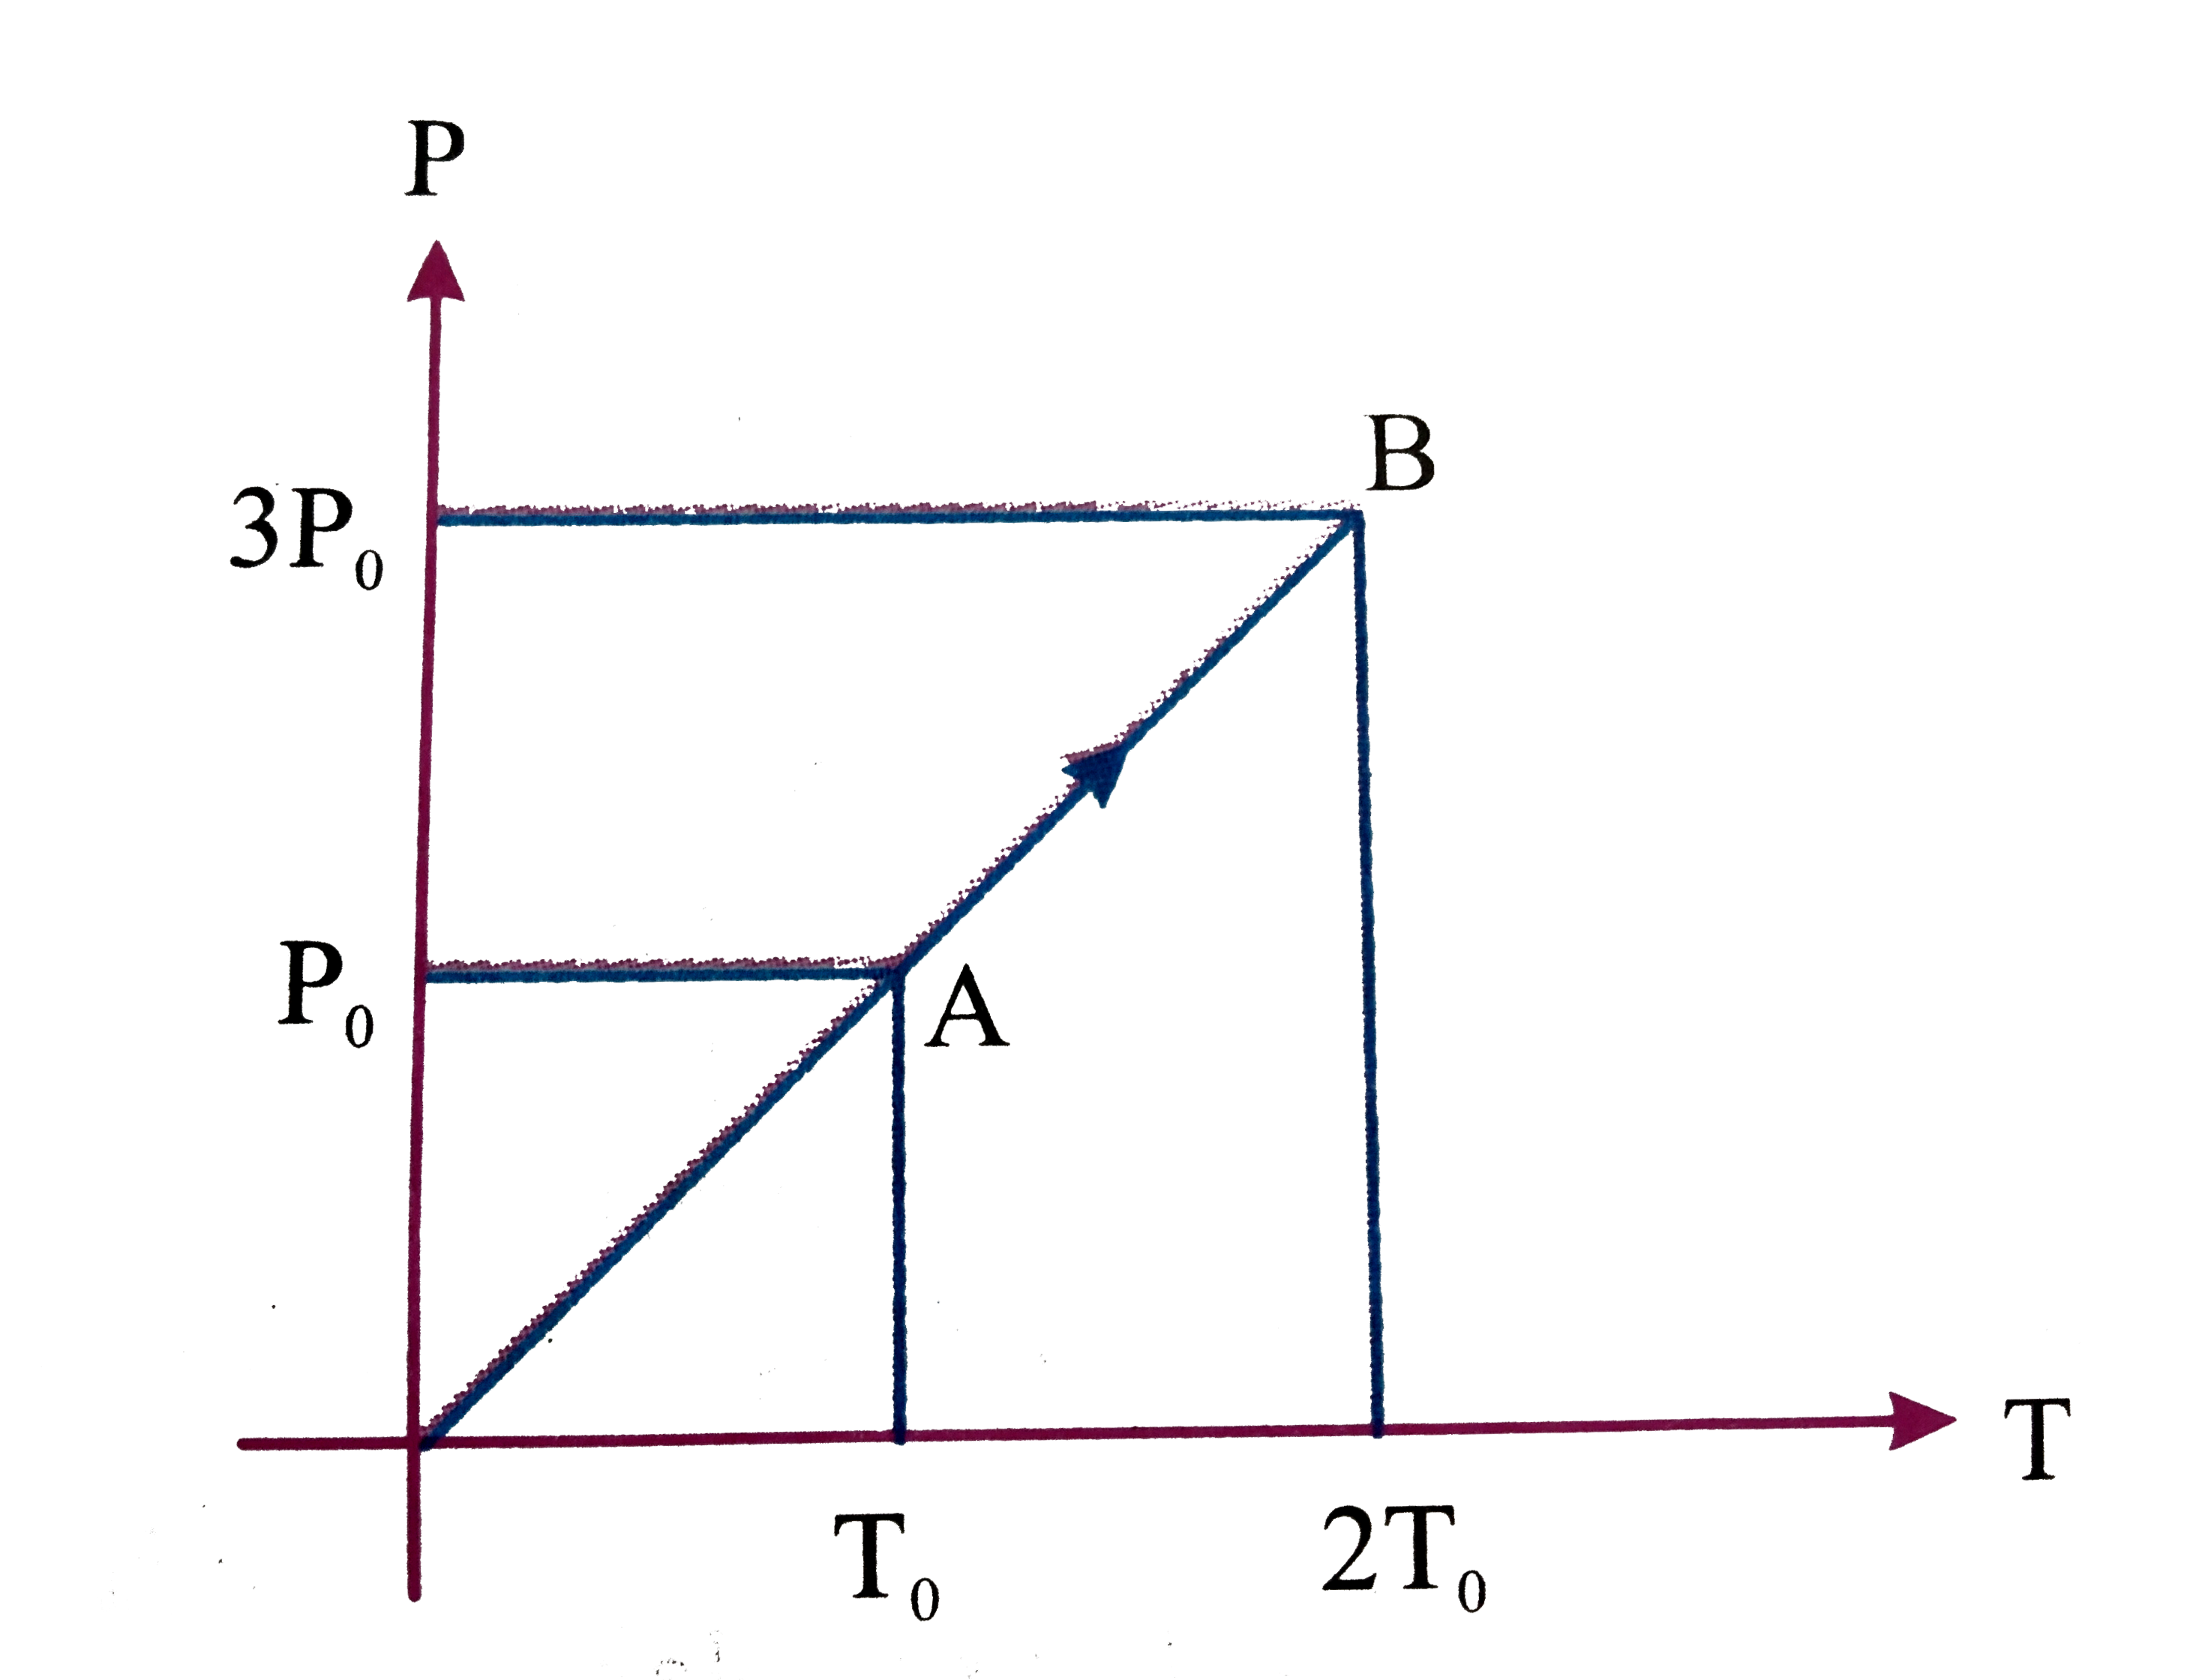
View SolutionPressure versus temperature graph of an ideal gas is shown in figure. Density of the gas at point A is ρ0. Density at B will be
View Solution
